Using QA Results Dashboard
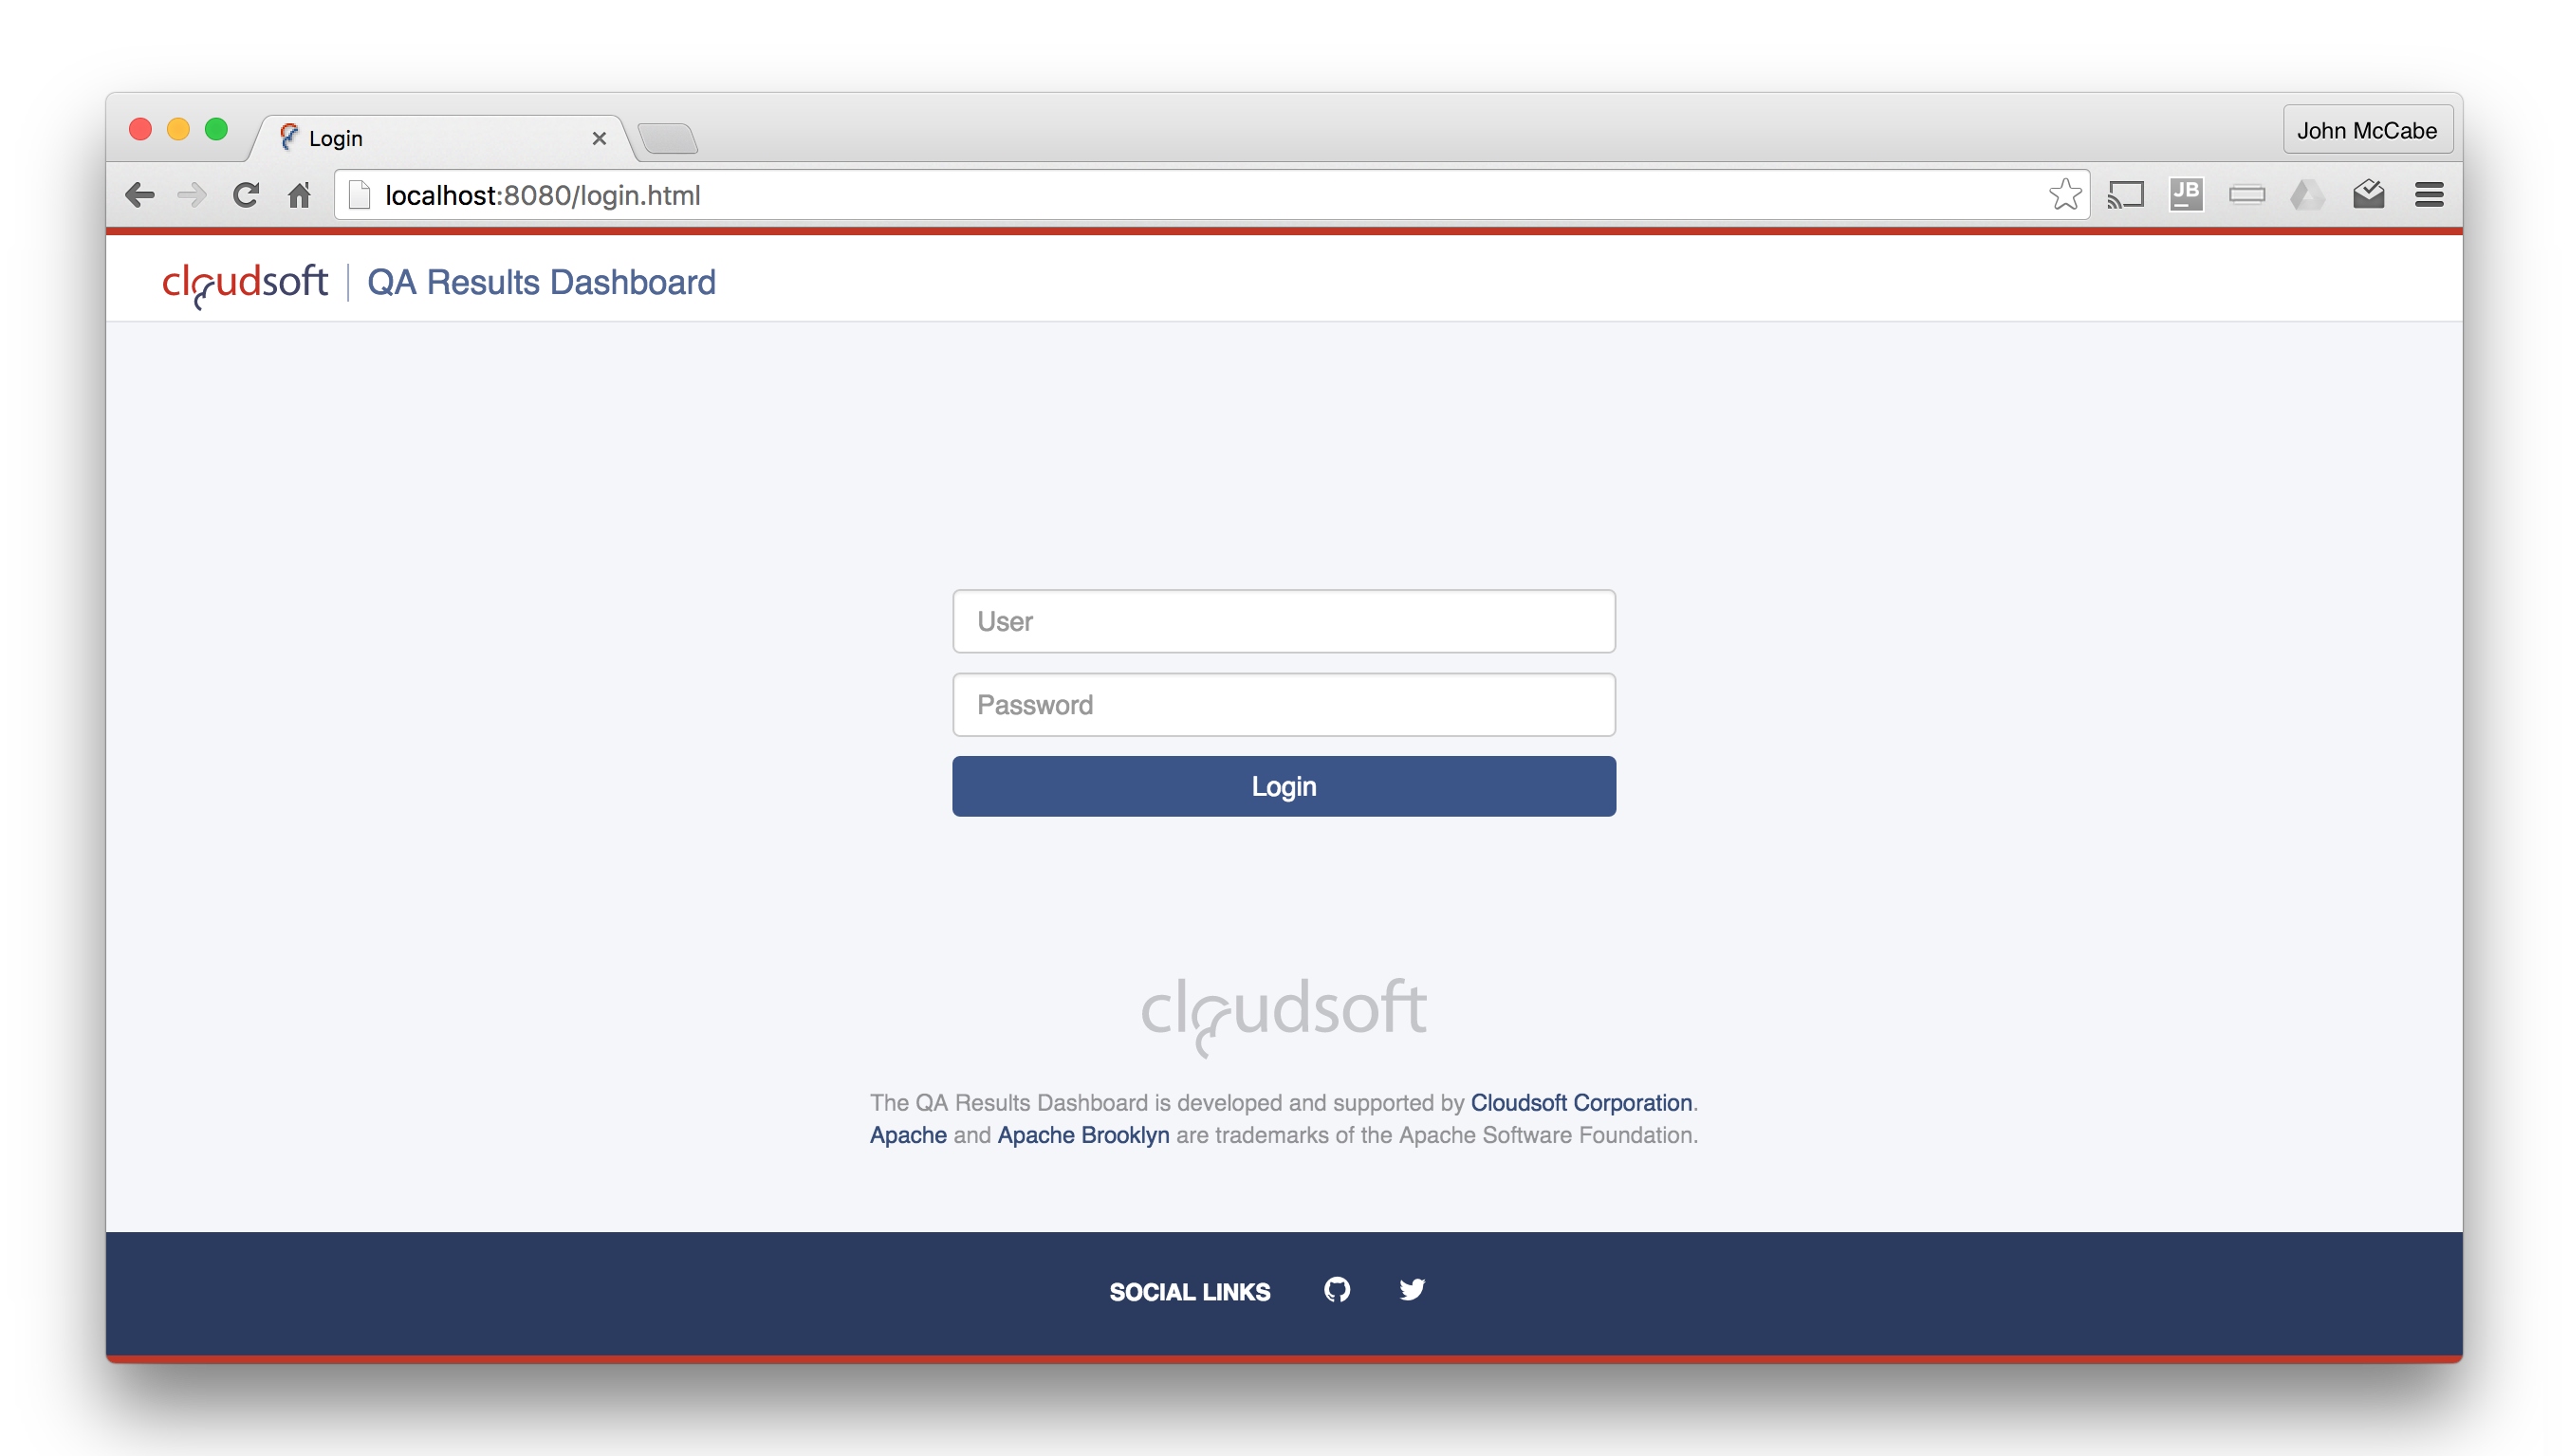
Login
The QA Results Dashboard is accessible at http://<server host>:8080/, you can log in with any CouchDB user which has read access to the Scheduler database.
The default credentials are:
- username: C0uchdb1!
- password: Cl0udsoftamp1!
Home Page
The main page displays a dynamically refreshed status overview of all test suite results.
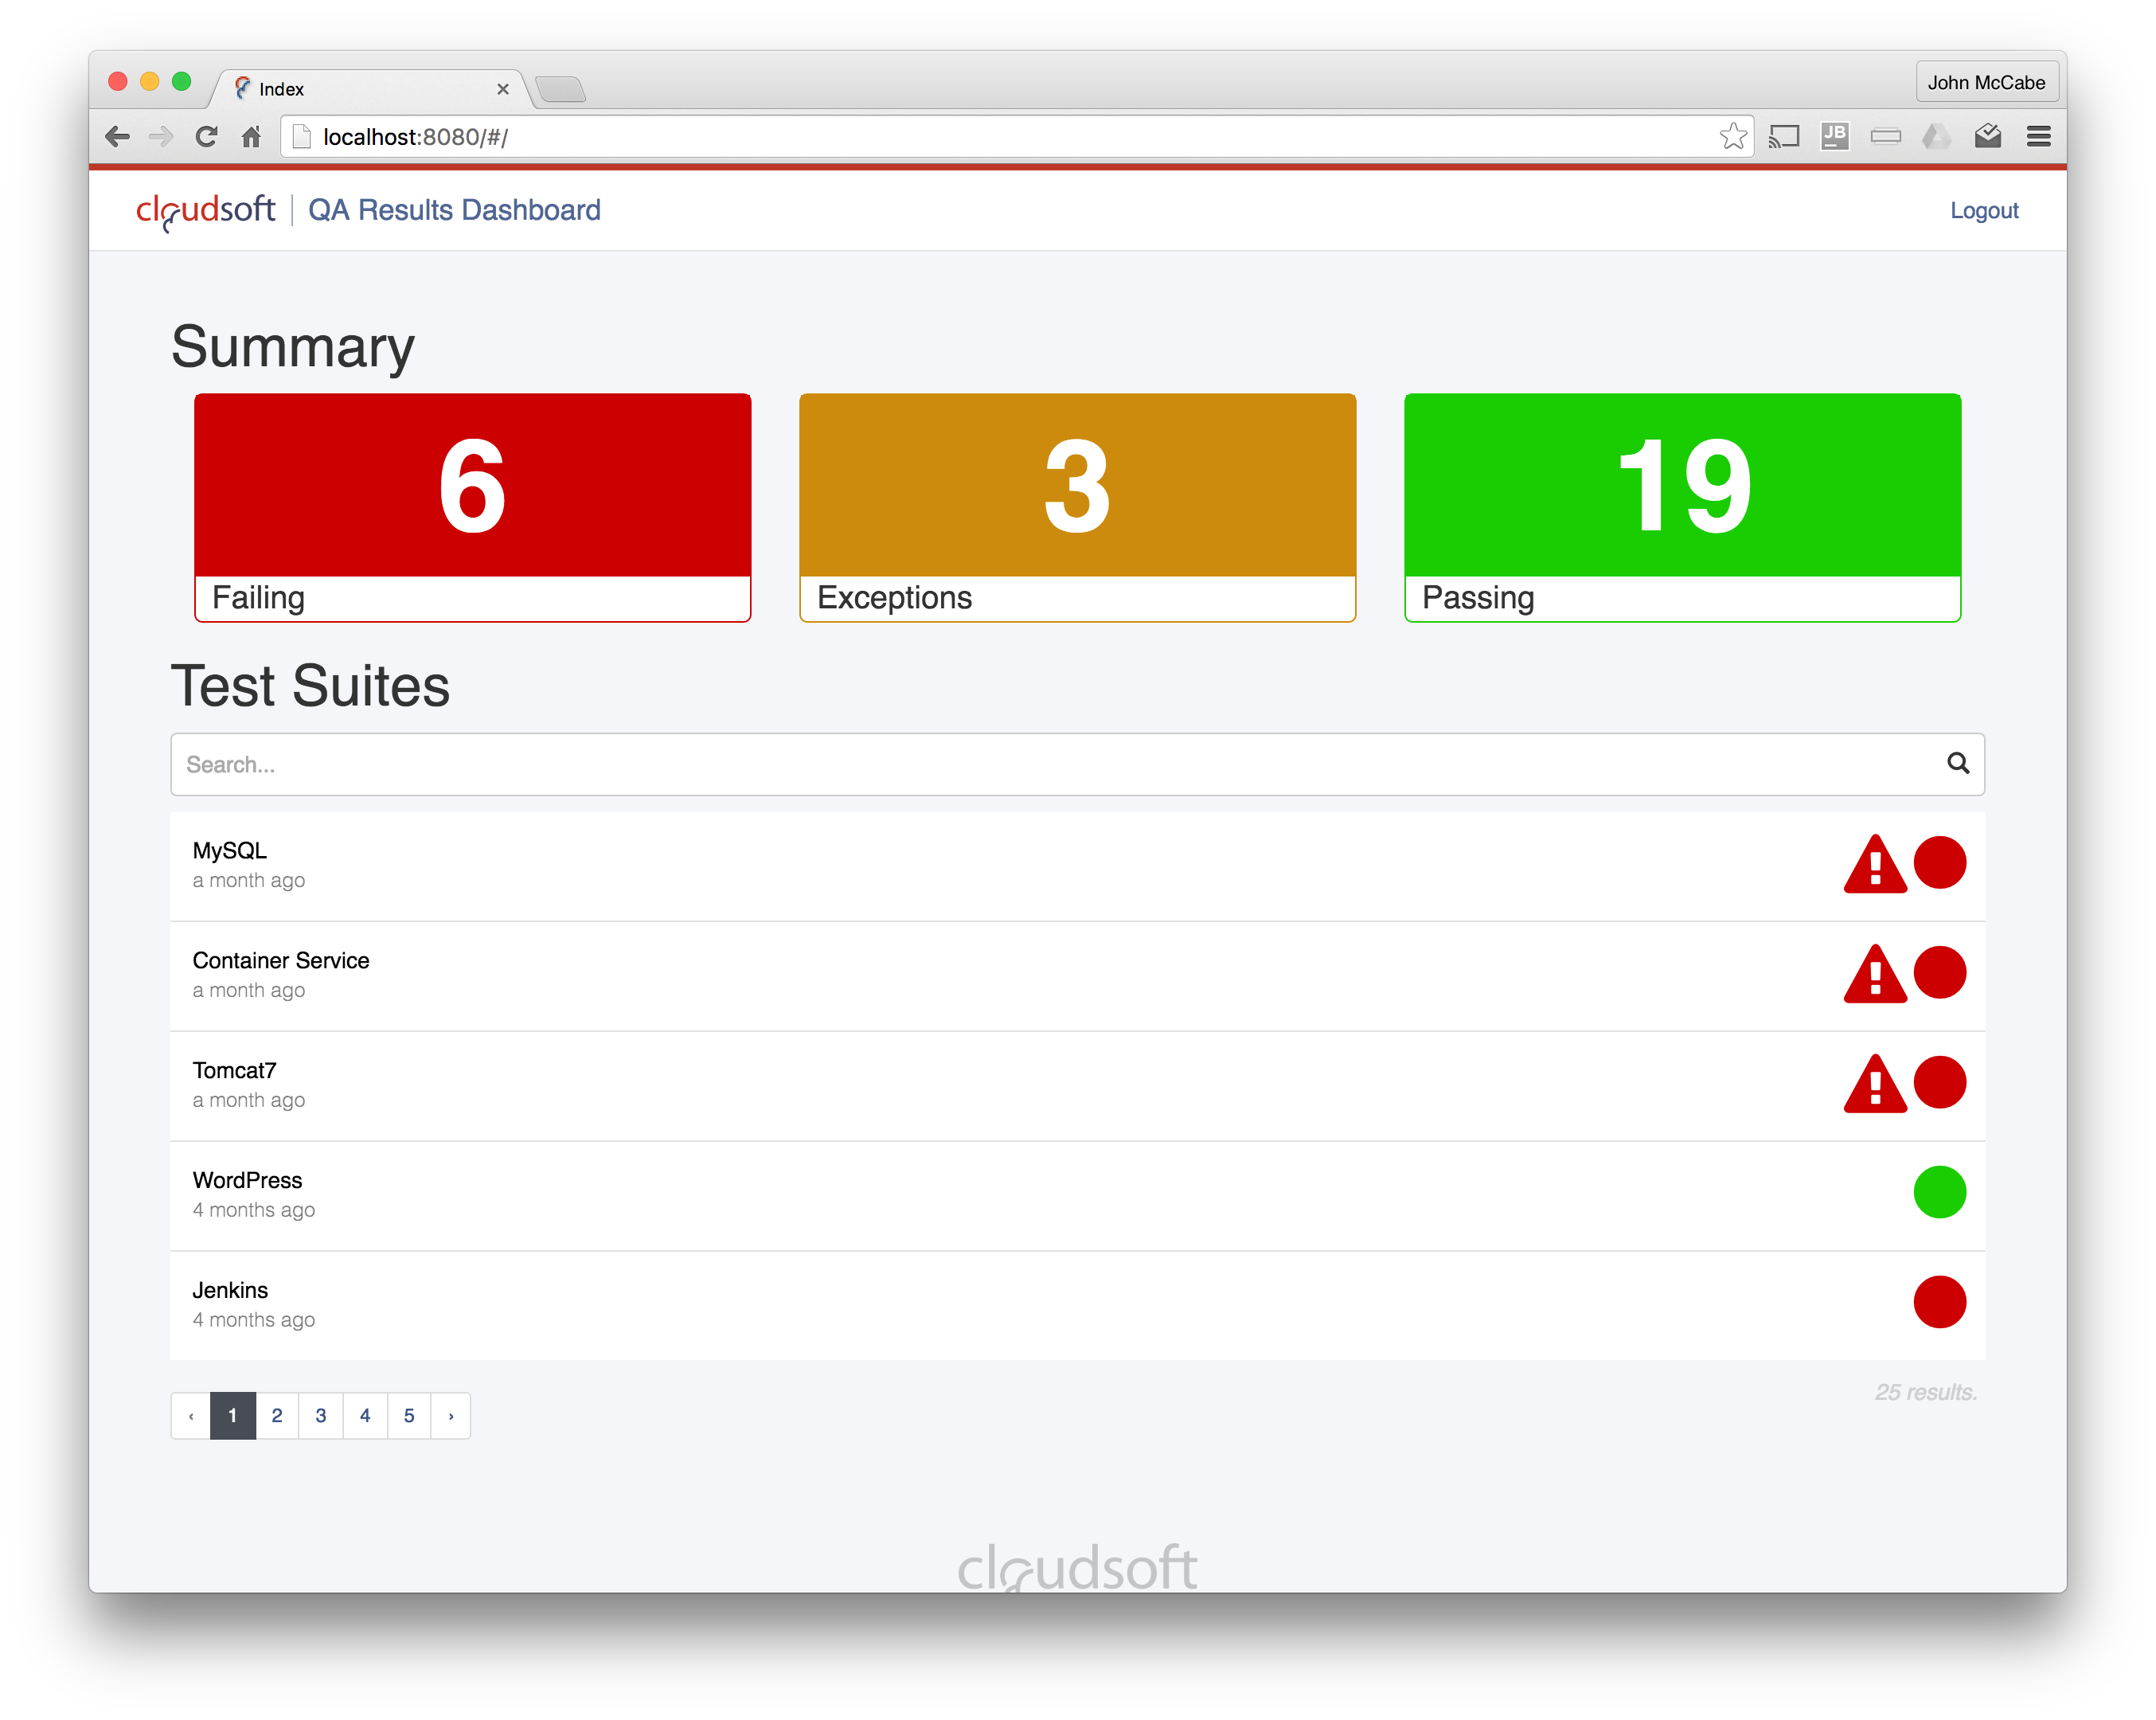
Summary
Displayed at the top of the page is a count of test suites which are in a failed, passed, or exception state.
- Failed - a test suite for whom at least 1 recent test run for a combination of Location and AMP tags has Failed.
- Passed - a test suite for whom recent test runs for all combinations of Location and AMP tags have Passed.
- Exceptions - a test suite for whom at least 1 recent test run has resulted in an Exception, these are usually indicative of an error in the test YAML, location or AMP instance where the test has been executed. These also count as Failed test suites.
Test Suites
Below this is a paginated list of test suite result summaries in chronological order with the most recent first, each row displaying:
- the test suite name
- how recently a test in that suite was executed
- a warning indicator if a recent result has thrown an exception
- a pie chart indicating the pass/fail coverage for that suite of all the executed combinations of location and AMP version
- a popover is displayed if you mouseover the pie chart containing a table with detailed results for all executed combinations of location and AMP version
This list is dynamically updated and may also be searched with the following keys:
- name - the name of the test suite as set in the
suiteNameparameter of the QA SchedulersnewTesteffector, partial matches are also returned - result - one of
PASSED,FAILED,EXCEPTION - location - the location where a test has been executed as set in the
locationTagparameter of the QA SchedulersnewTesteffector, partial matches are also returned - brooklyn - the AMP version as set in the
brooklynTagparameter of the QA SchedulersnewTesteffector, partial matches are also returned
Clicking a row drills down to that test suite’s results list page.
Test Suites Result List Page
This page displays a list of test suite results for all combinations of location and AMP version for a single test suite.
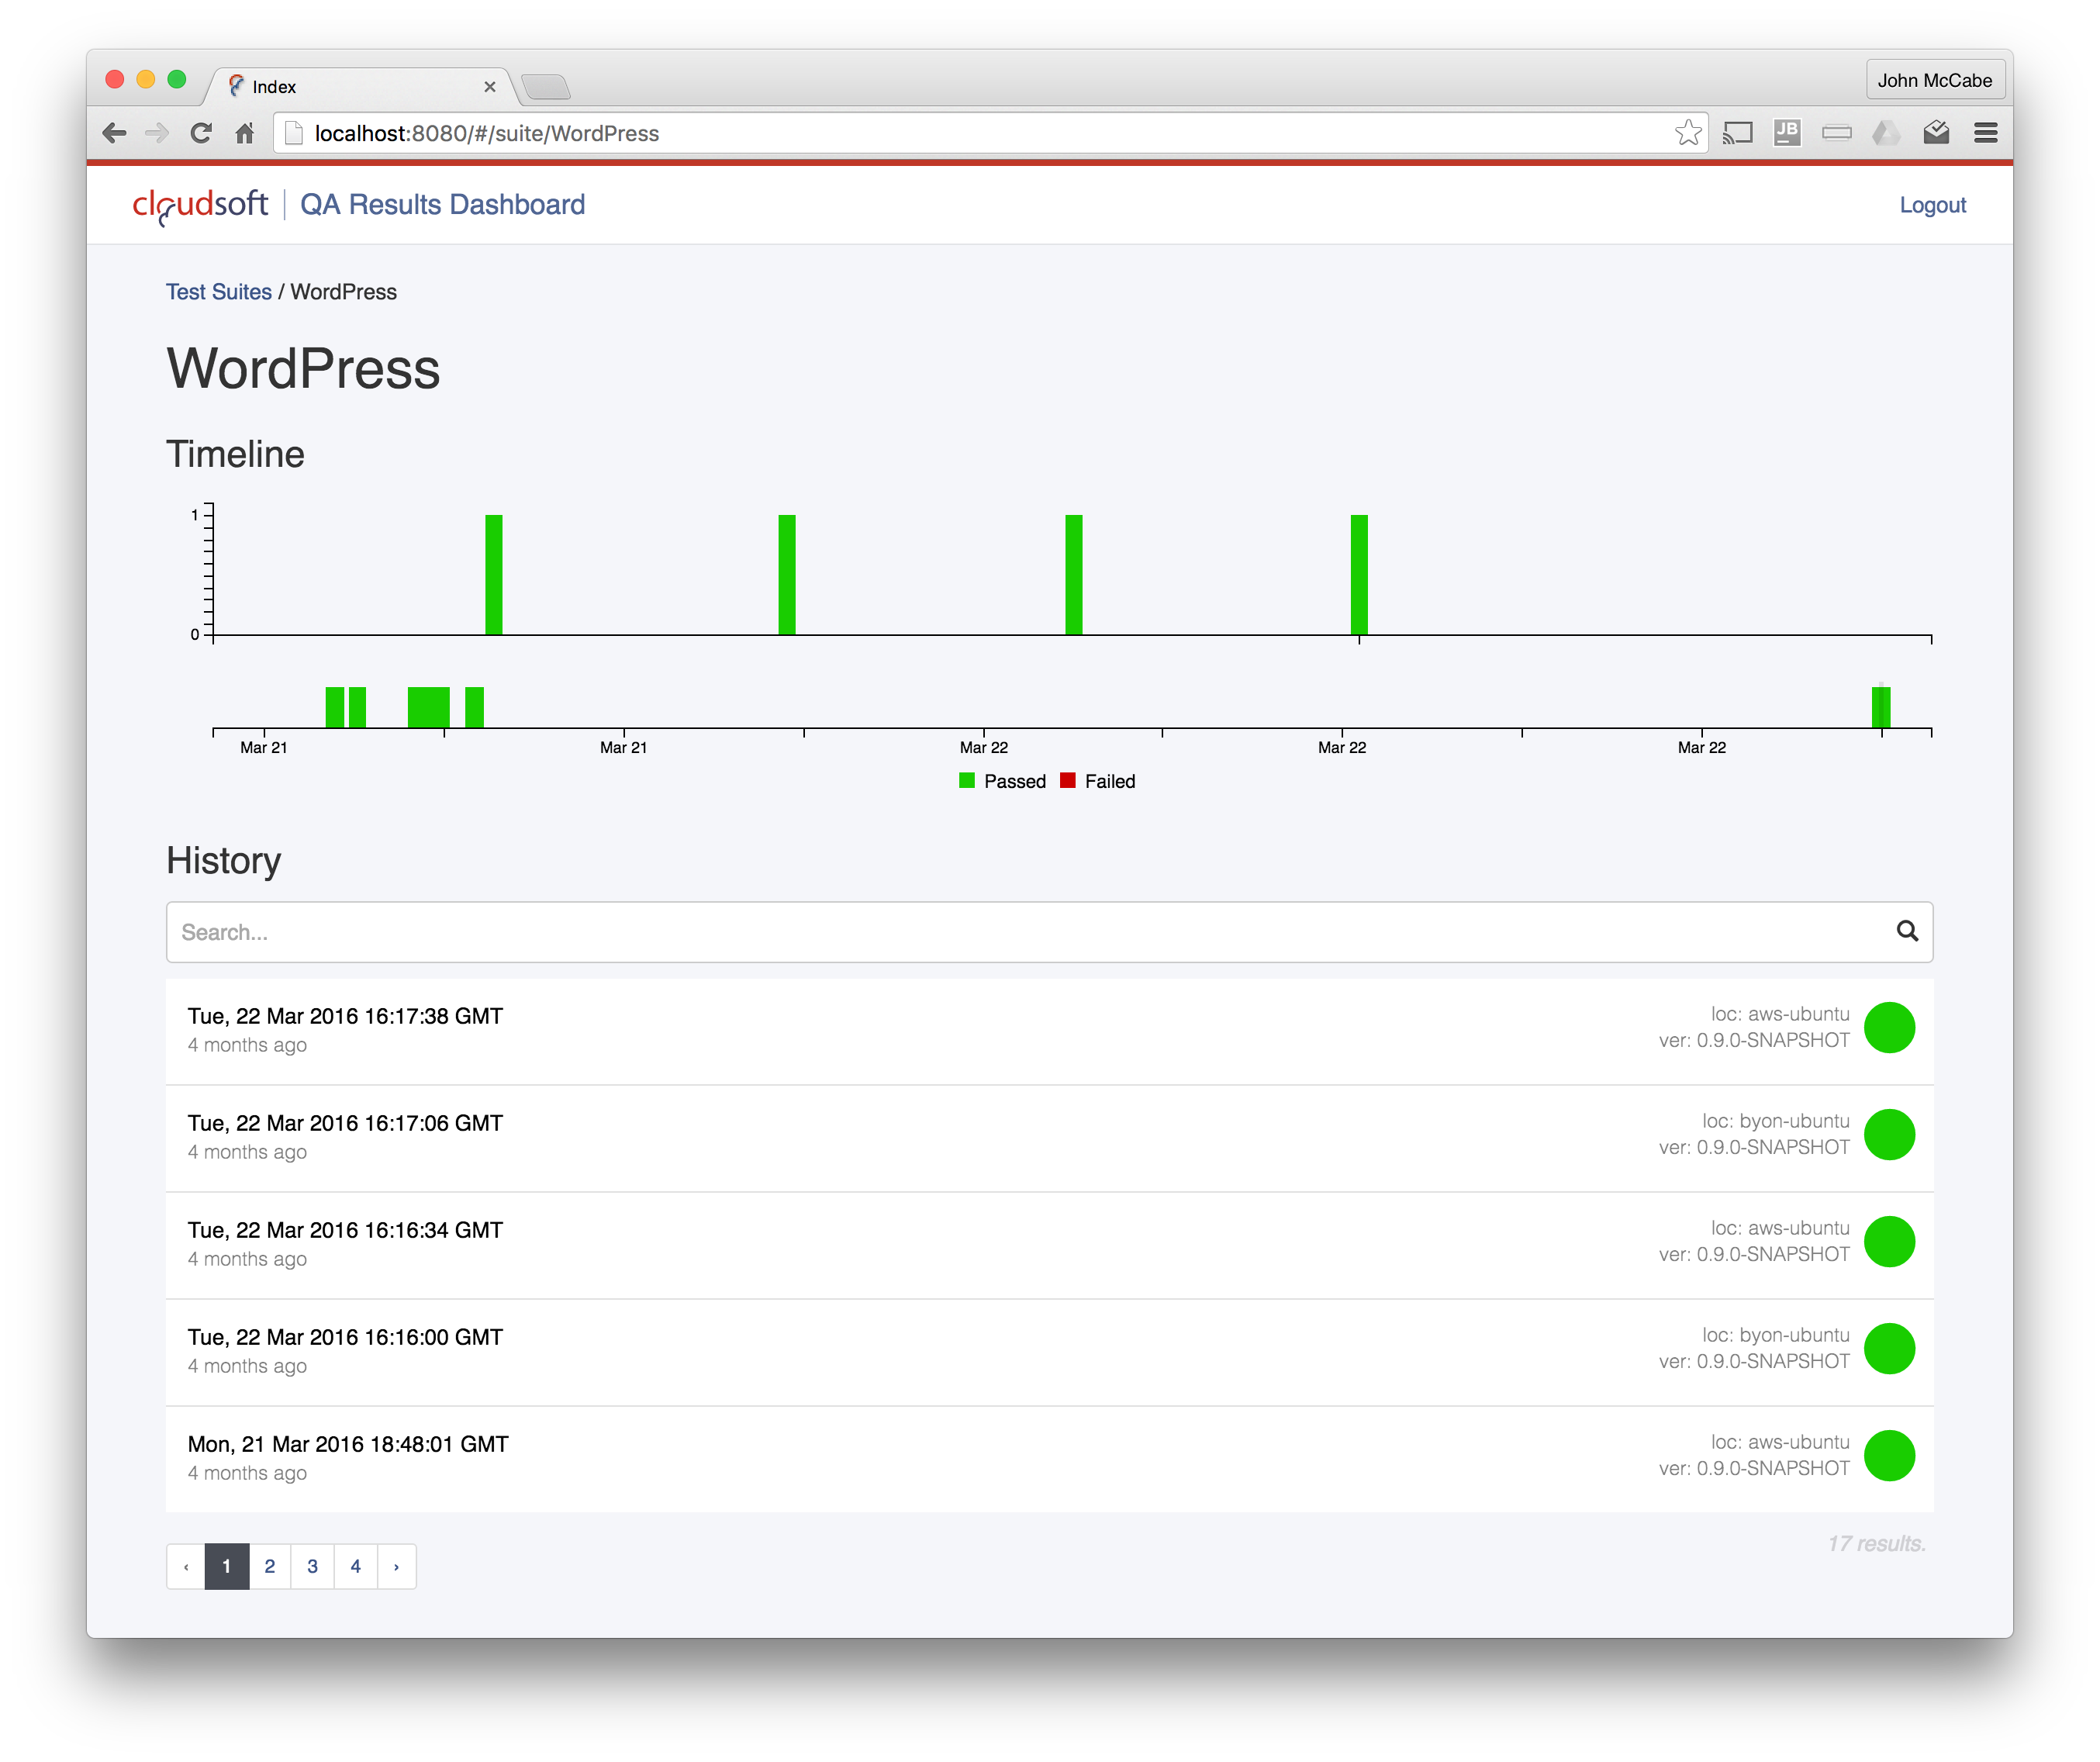
Displayed at the top of the page is a timeline showing the temporal distribution of test suite executions, this uses stacked bars to indicate the number of tests passed/failed within each test suite execution, moving your mouse over a bar displays more detailed information on the test passed/failed.
Below this is a paginated list of test suite execution results in chronological order with the most recent first, each row displaying:
- date the test suite result was generated
- location tag where the test suite was executed
- version tag indicating the AMP version the test suite was executed on
- a pie chart indicating the pass/fail coverage for the tests within the test suite (suites can containe 1 or more test cases)
This list may be searched with the following keys:
- result - one of
PASSED,FAILED,EXCEPTION - location - the location where a test has been executed, partial matches are also returned
- brooklyn - the AMP version where a test has been executed, partial matches are also returned
- from - the date after which a test must have been executed, click the down arrow to open a date selector
- to - the date before which a test must have been executed, click the down arrow to open a date selector
Clicking a row drills down further to the result page for that specific run of the test suite.
Test Suite Result Page
This page displays an overview of the results for a specific run of a test suite.
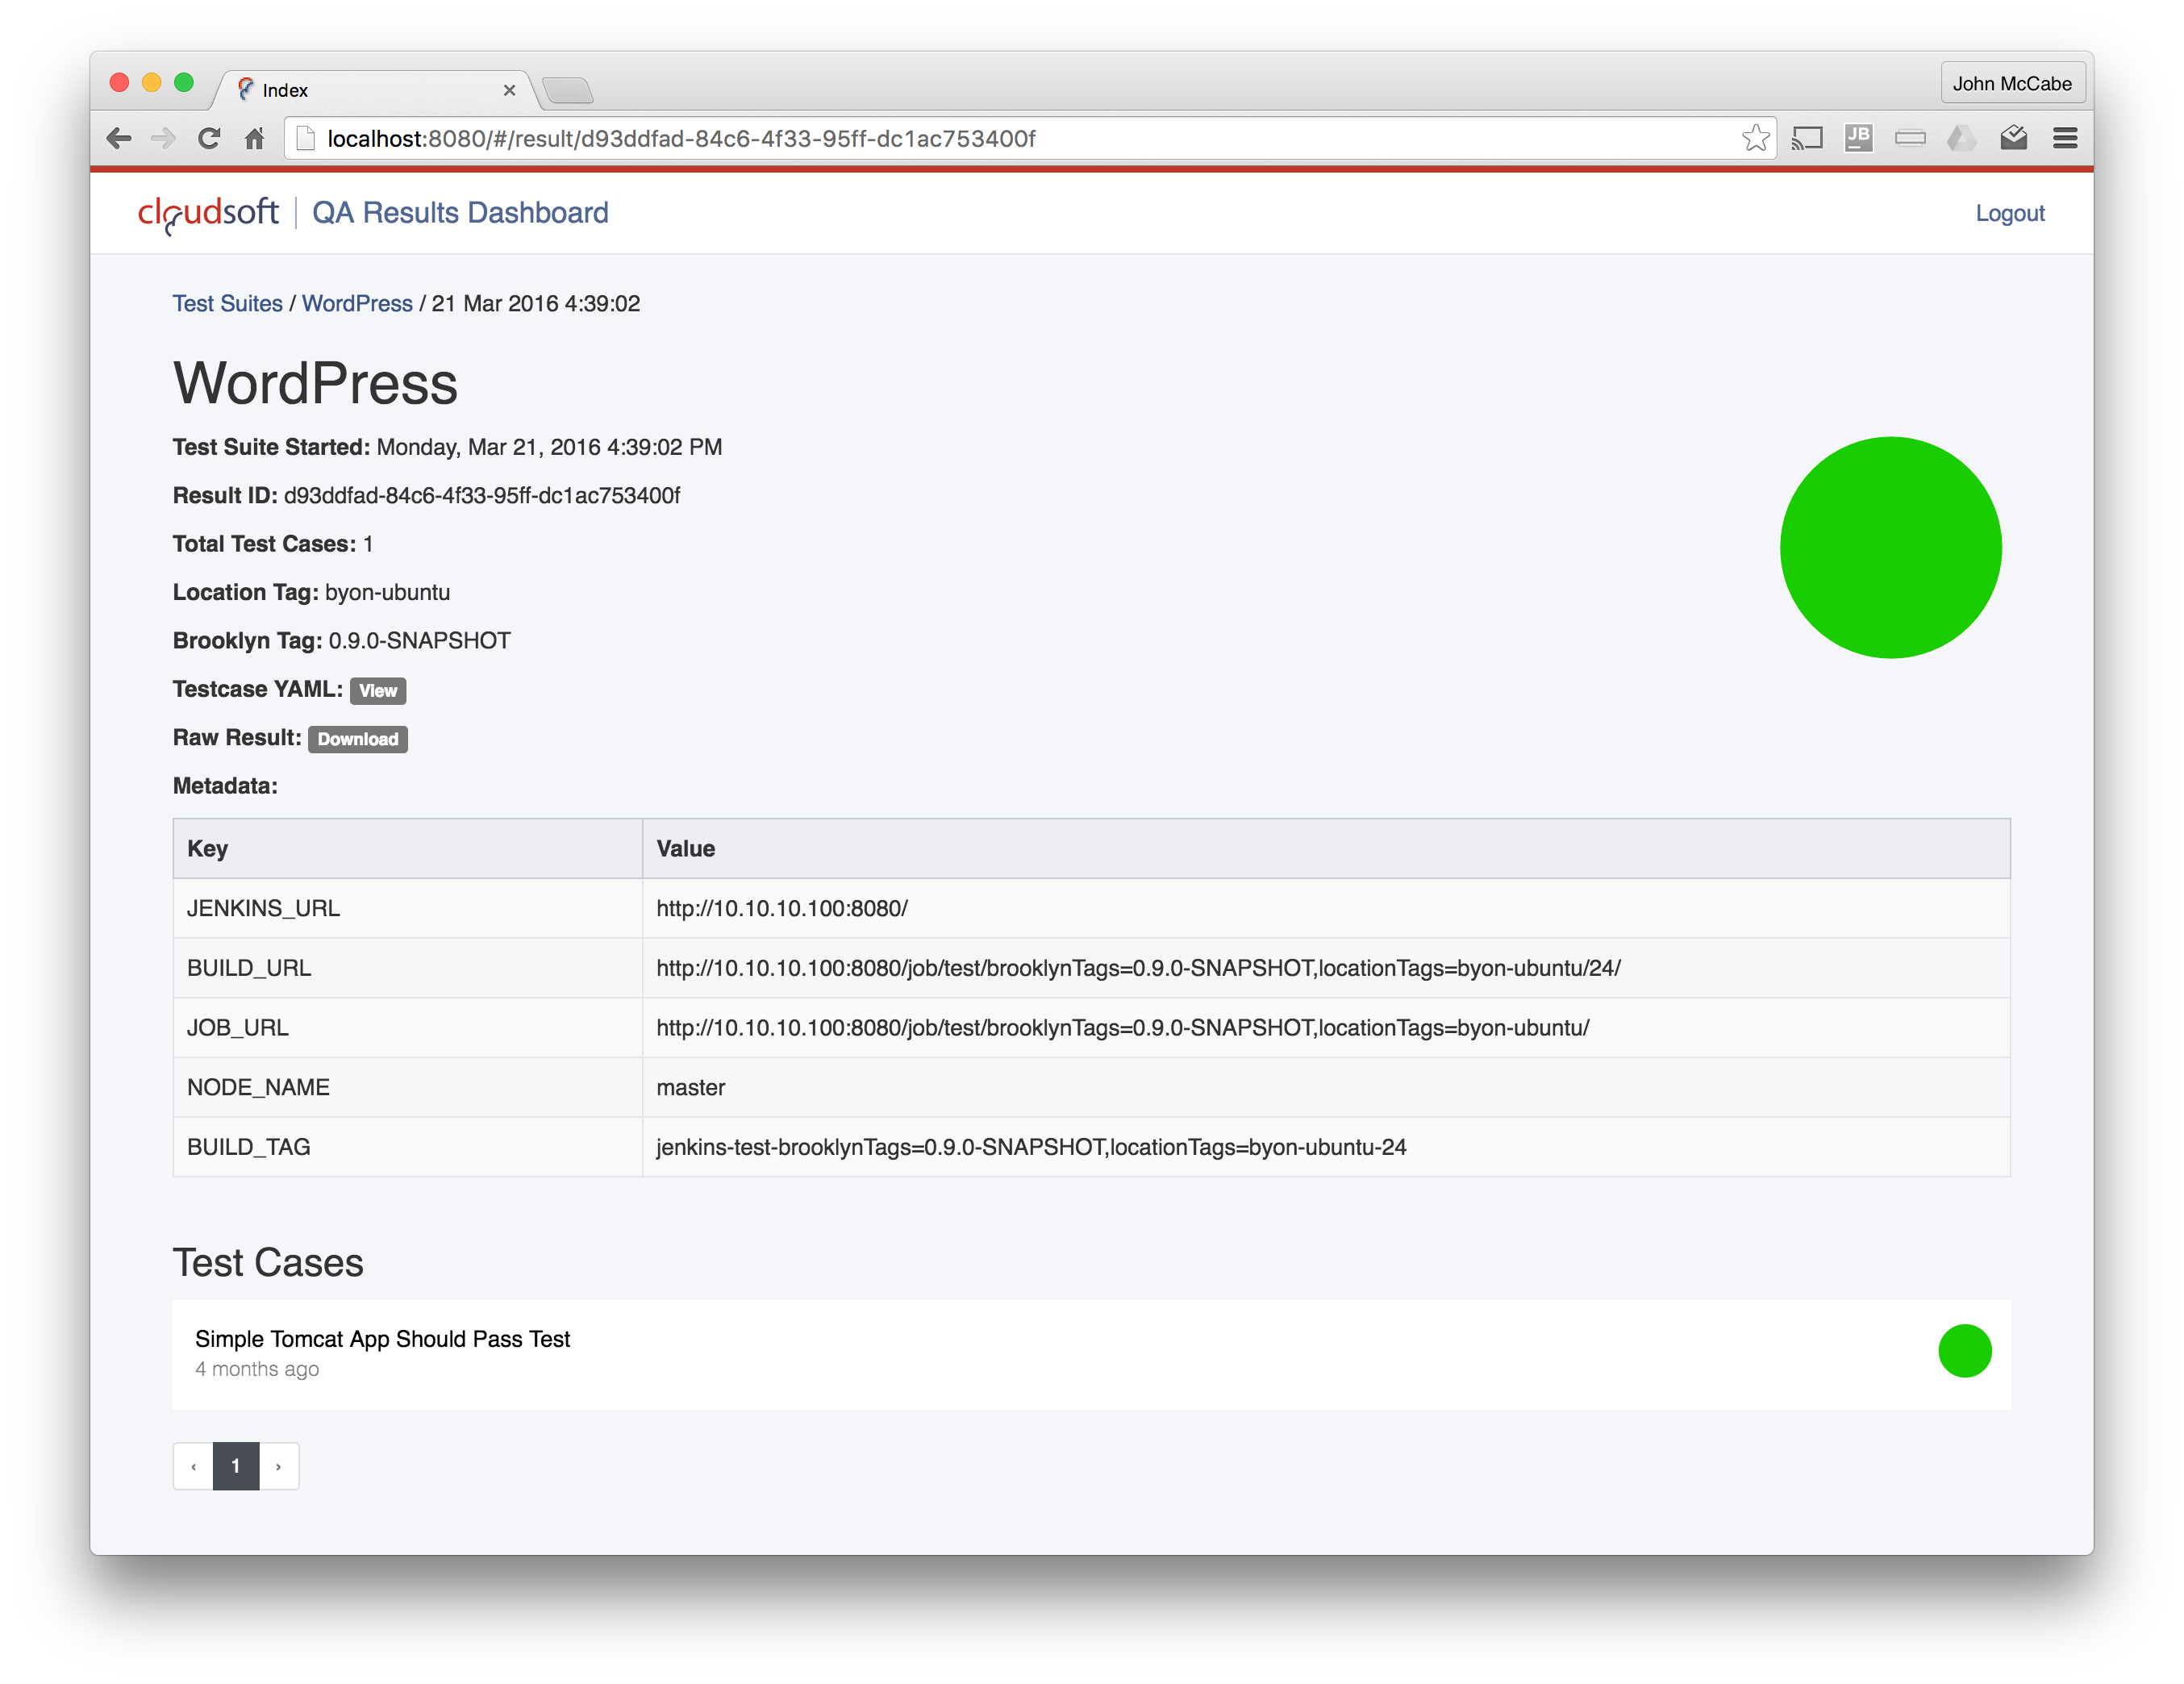
The page displays the following information:
- Pie Chart - this chart displays the pass/fail ratio of test cases within the test suite result
- Test Suite Started - timestamp indicating when the test suite was started for this result
- Result ID - a unique identifier for the result
- Total Test Cases - count of the test cases within the test suite result
- Location Tag - location where the test suite was executed, this is the same tag as configured in the test scheduler via the
newLocationTageffector - AMP Tag - AMP version where the test suite was executed, this is the same tag as configured in the test scheduler via the
newAMPTageffector - Testcase YAML - displays a modal containing the Application and Testcase YAML from the executed test suite
- Raw Result - allows the user to download the raw JSON result document
- Metadata - [optional] contains the metadata passed in the optional
metadataparameter to thenewTesteffector in the test scheduler. This can be used to store custom information along with the standard results, in the example above it has been used to store information from Jenkins where the test case had been initiated from.
It also includes a list of test cases as defined in the test suite, displaying the following:
- the display name of the test case
- how recently the testcase was executed
- a pie chart indicating the ratio of test cases which are in a passed or failed state
Clicking on a row will drill down to the detailed result for the chosen test case.
Test Case Result Page
This page displays an overview of the results for a specific test case.
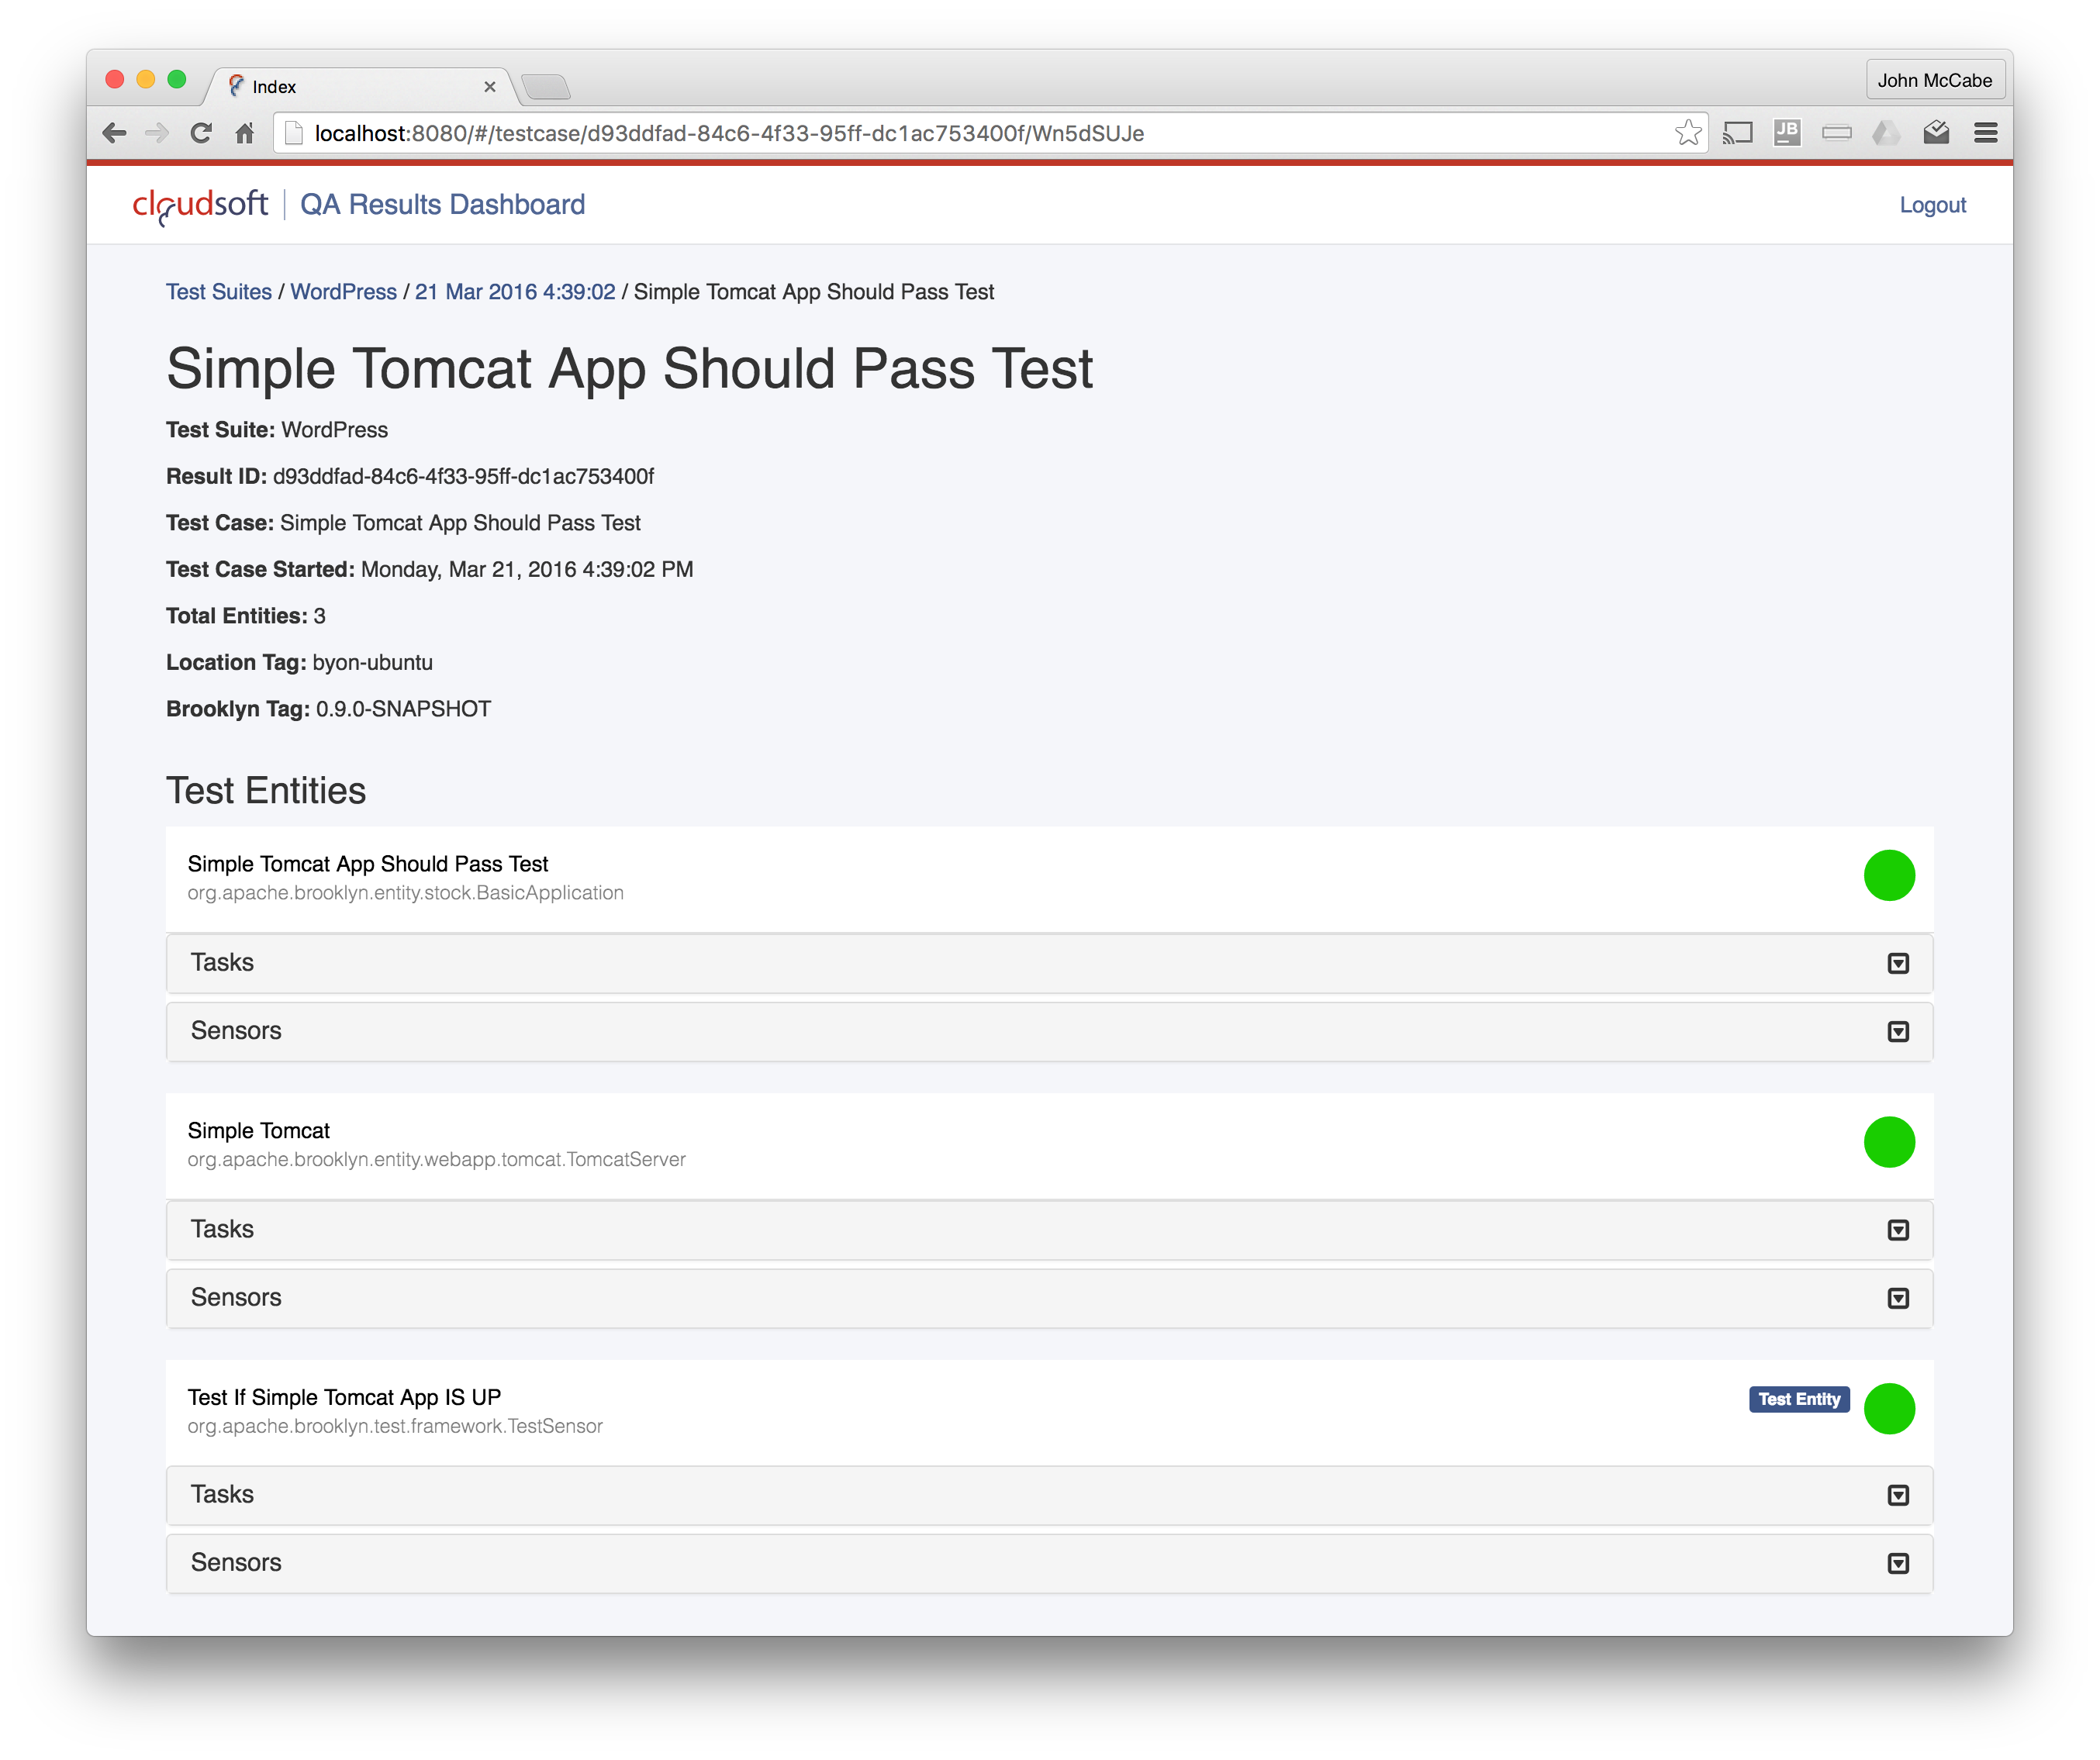
For each test case the following information is available:
- Test Suite - suite that this test case belongs to, also visible in the breadcrumb trail
- Result ID - a unique identifier for the result as stored in CouchDB
- Test Case - name of the test case whose result is being viewed
- Total Entities - total number of entities in the test case
- Location Tag - location where the test suite was executed
- AMP Tag - AMP version where the test suite was executed
Test Entities
This section displays a list of all entities found in the test case, with the following information displayed:
- entity name
- entity type
- a pie chart indicating the ratio of entities which are in a passed or failed state. Note that you may observe test entities which are considered to have passed but which contain tasks in an expected failed state, these failed tasks show up in the pie chart but do not count towards the overall pass/fail state of the entity.
- a collapsable and filterable list of associated tasks (if present)
- a collapsable list of associated sensors (if present)
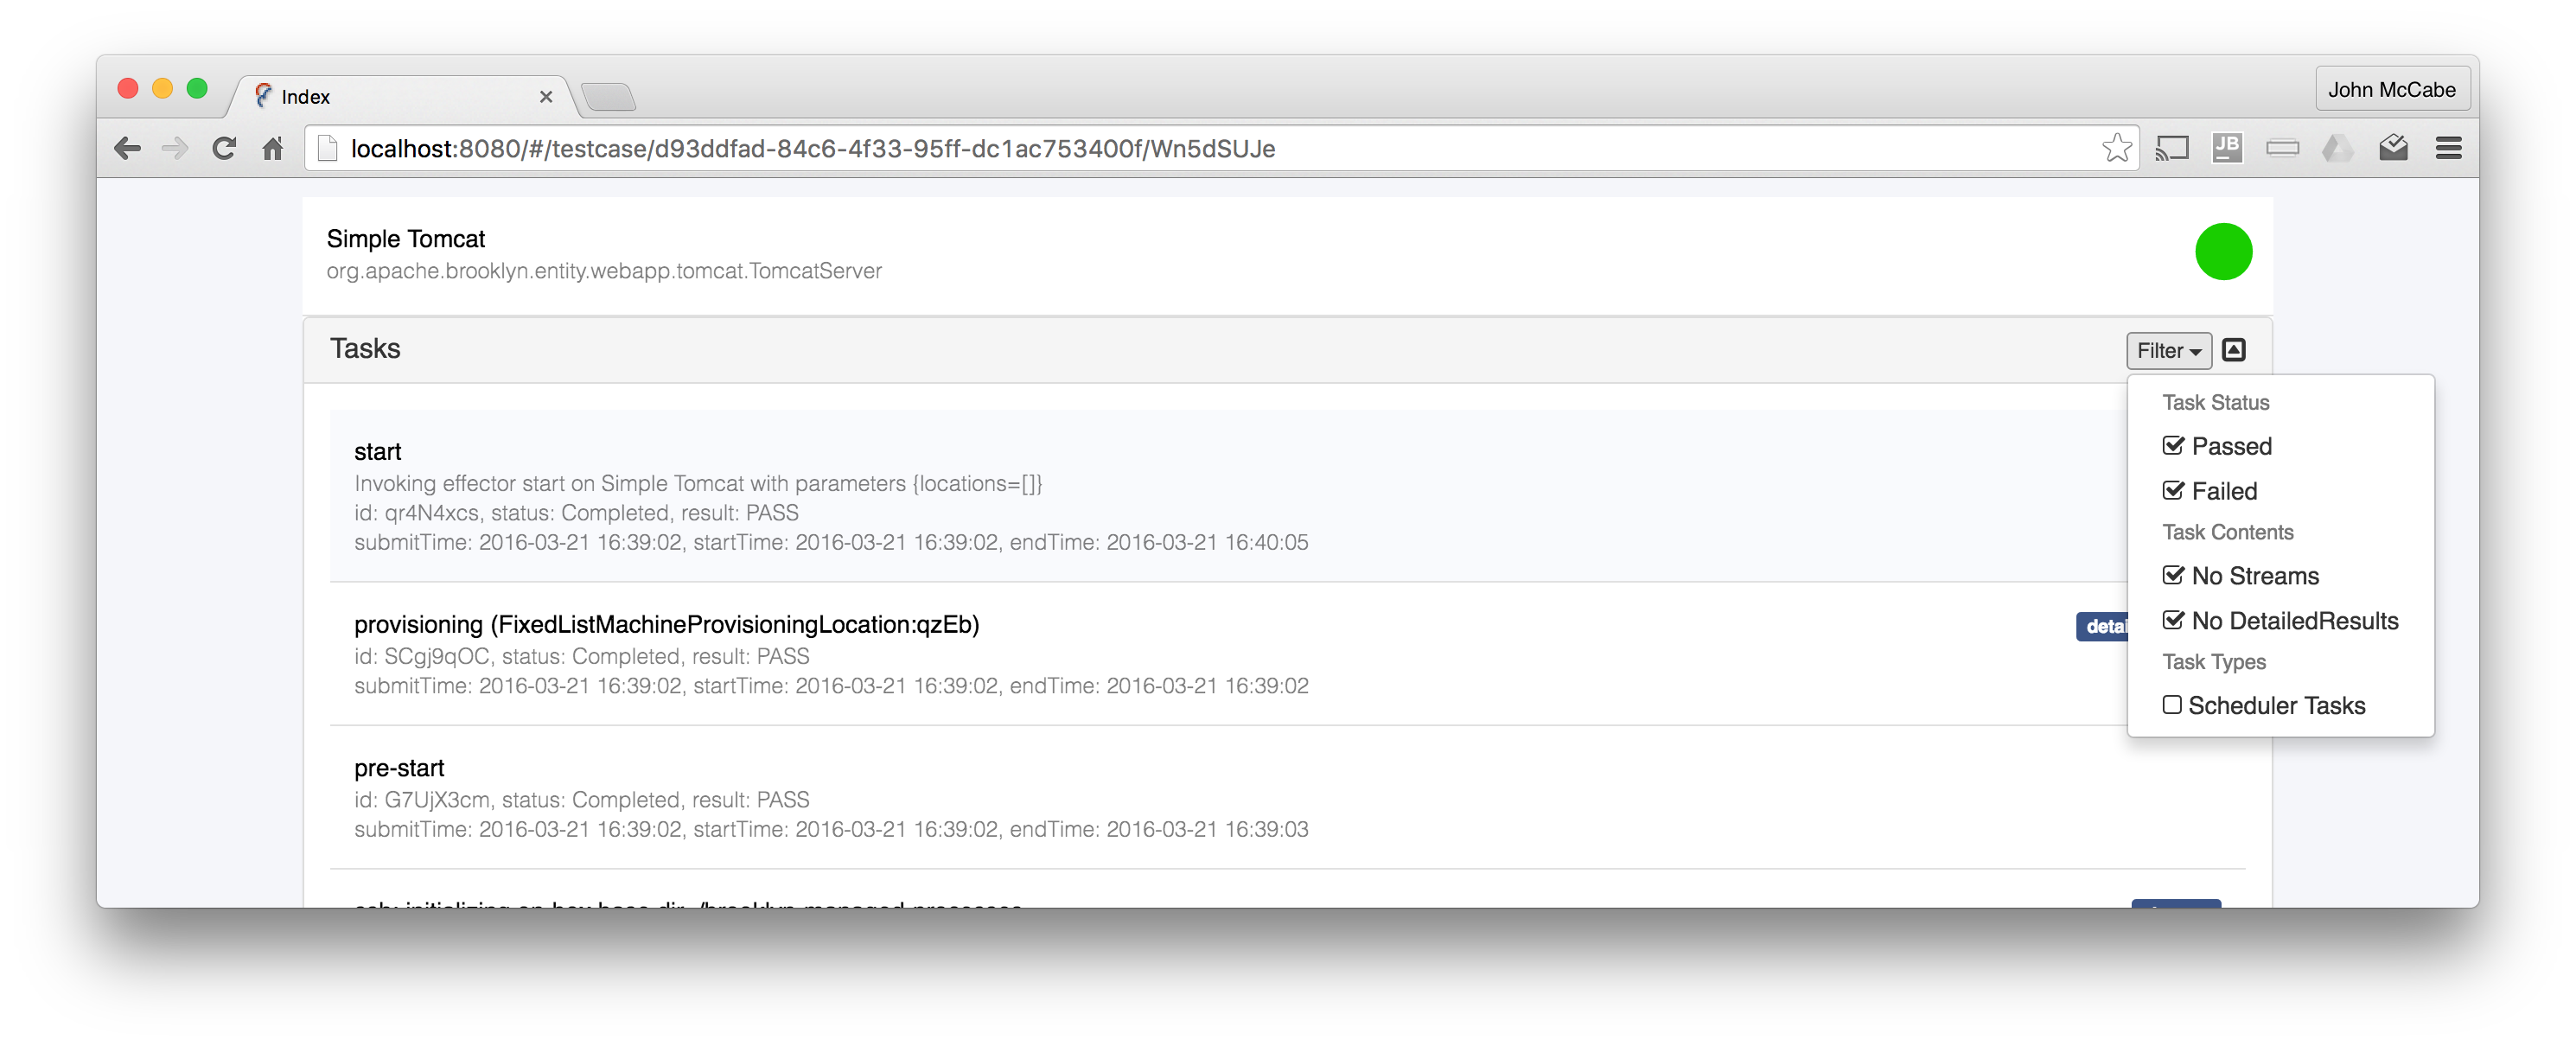
Clicking on the Tasks bar for an entity will display a filtered list of associated tasks. The following filters are available:
- Passed - if selected include passed tasks in the list
- Failed - if selected include failed tasks in the list
- No Streams - if selected include tasks which contain no streams information in the list
- No DetailedResults - if selected include tasks which contain no detailed results information in the list
- Scheduler Tasks - if selected include tasks idenfitied as scheduler tasks in the list, this defaults to off
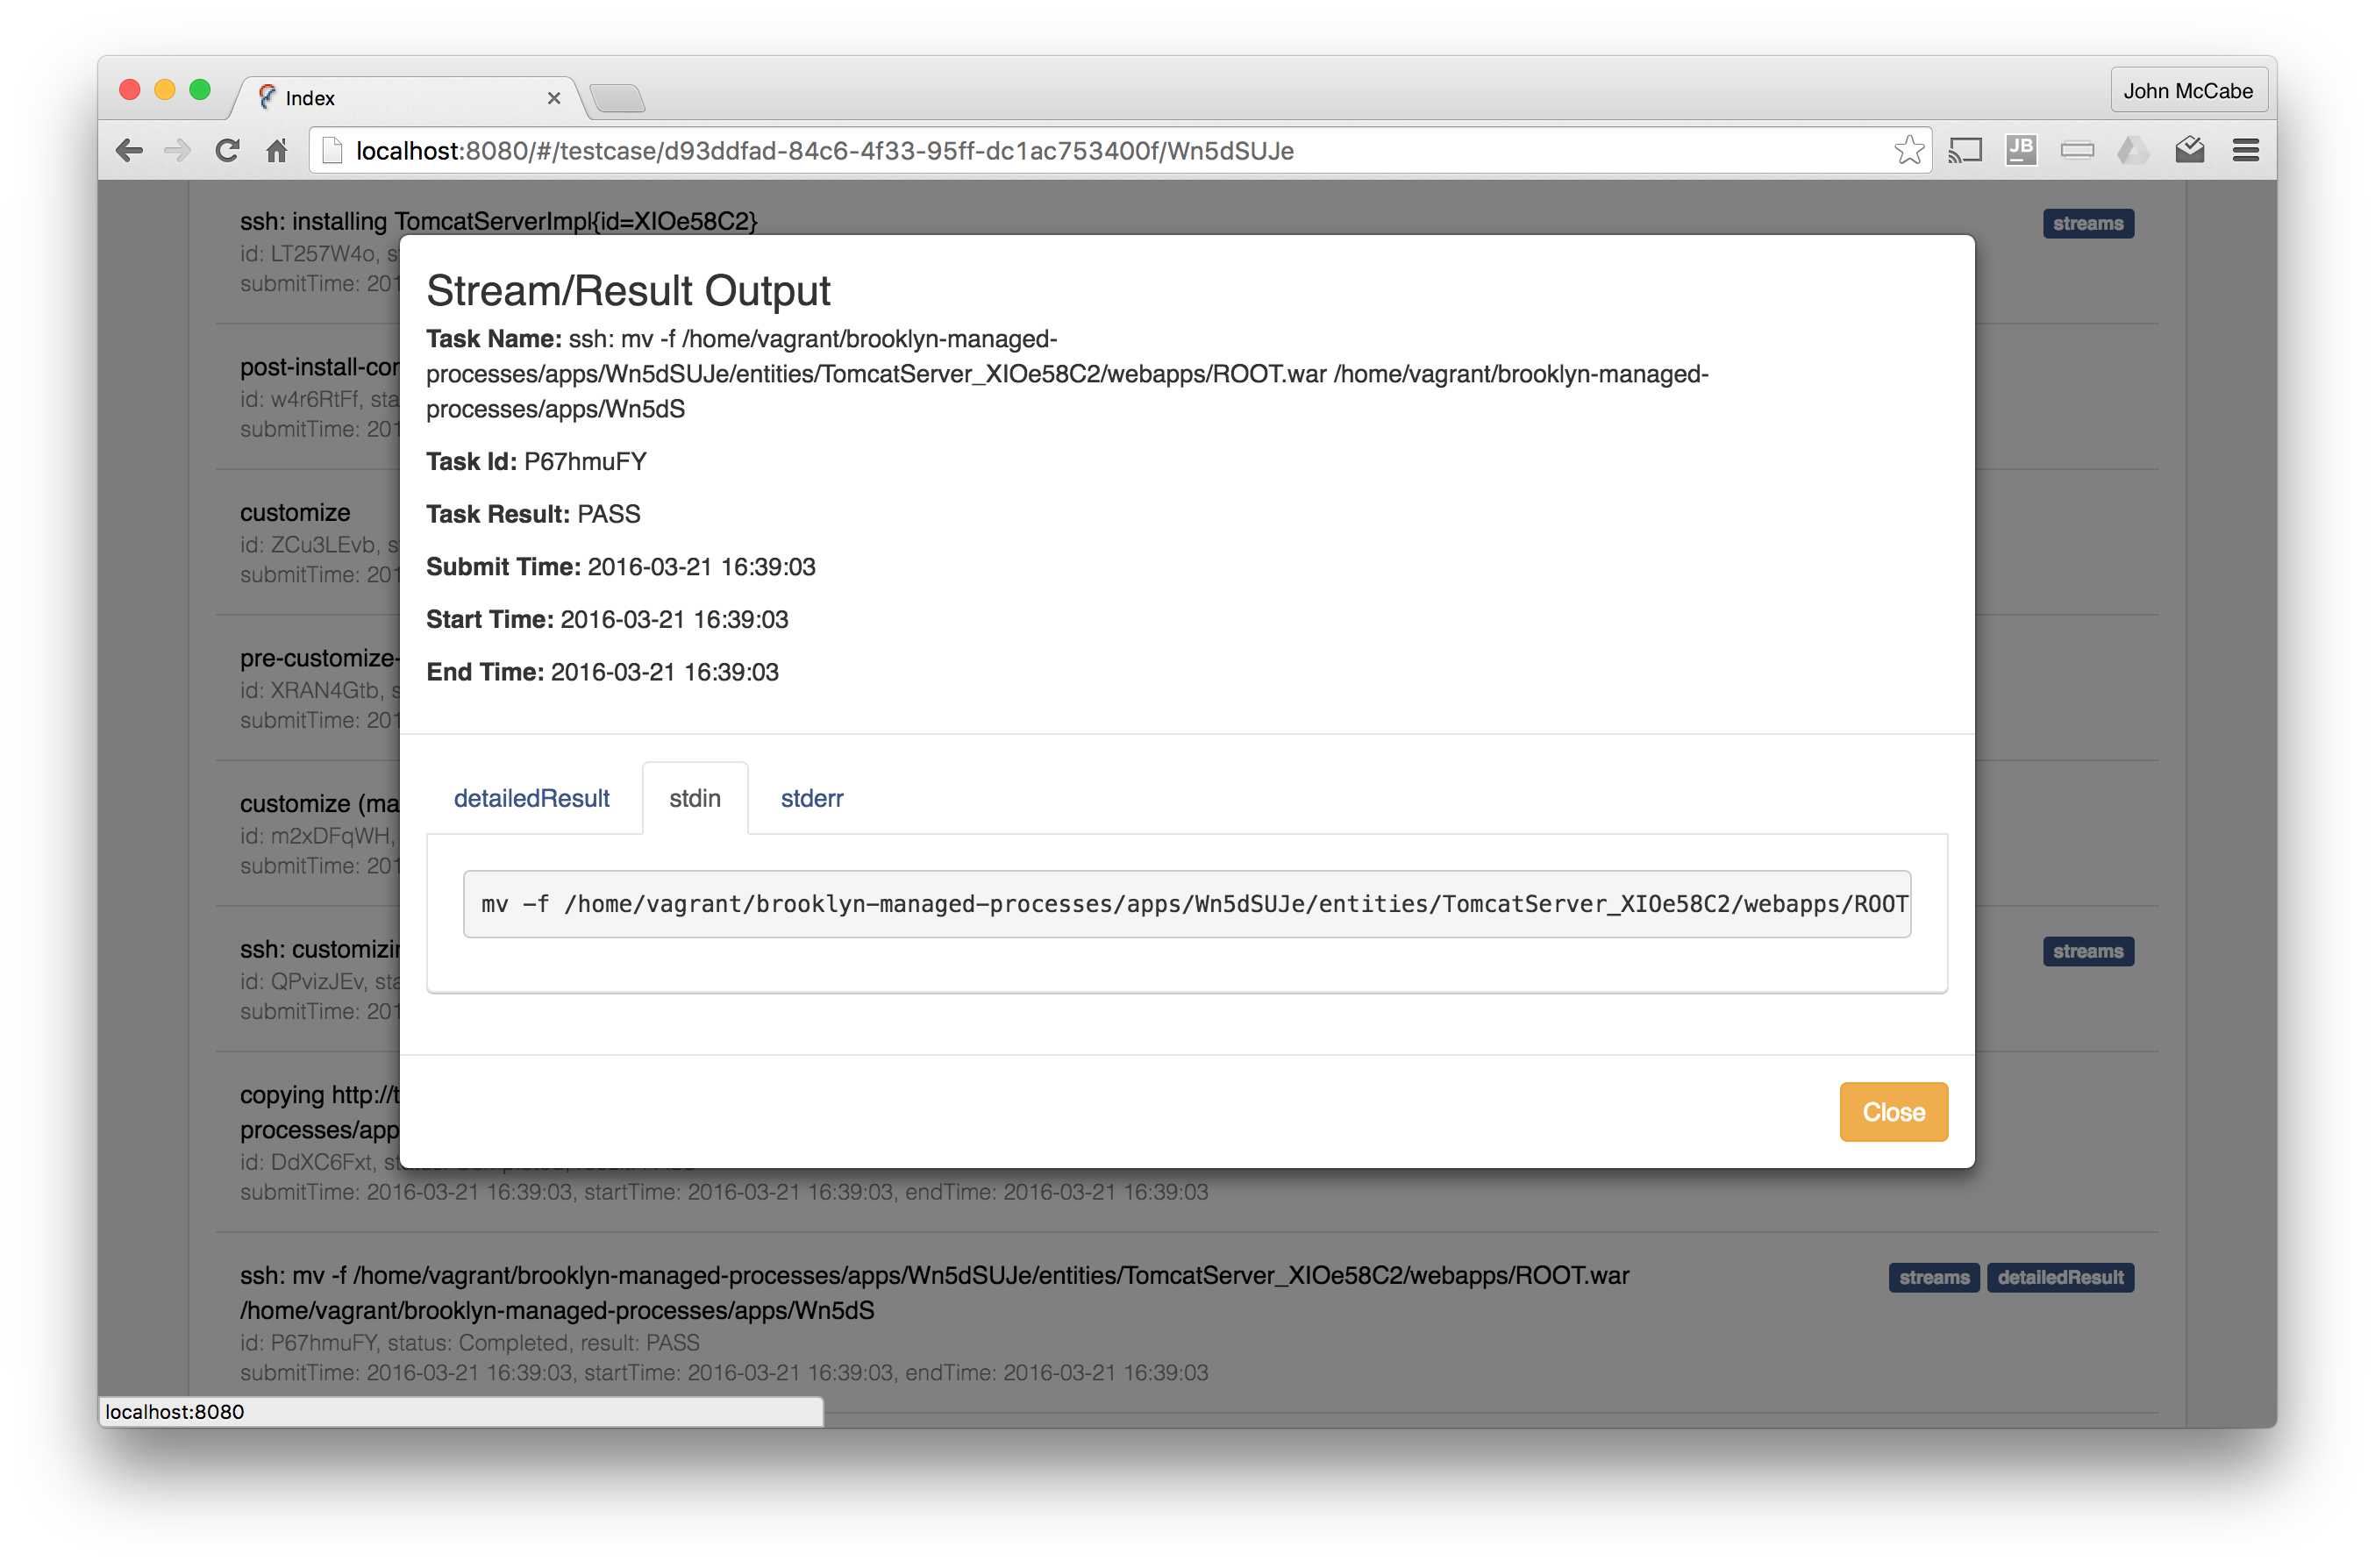
Tasks with a streams or detailedResults tag in the list can be clicked to display a modal containing the associated stream (stdin, stdout, stderr, env) and detailed results if present.
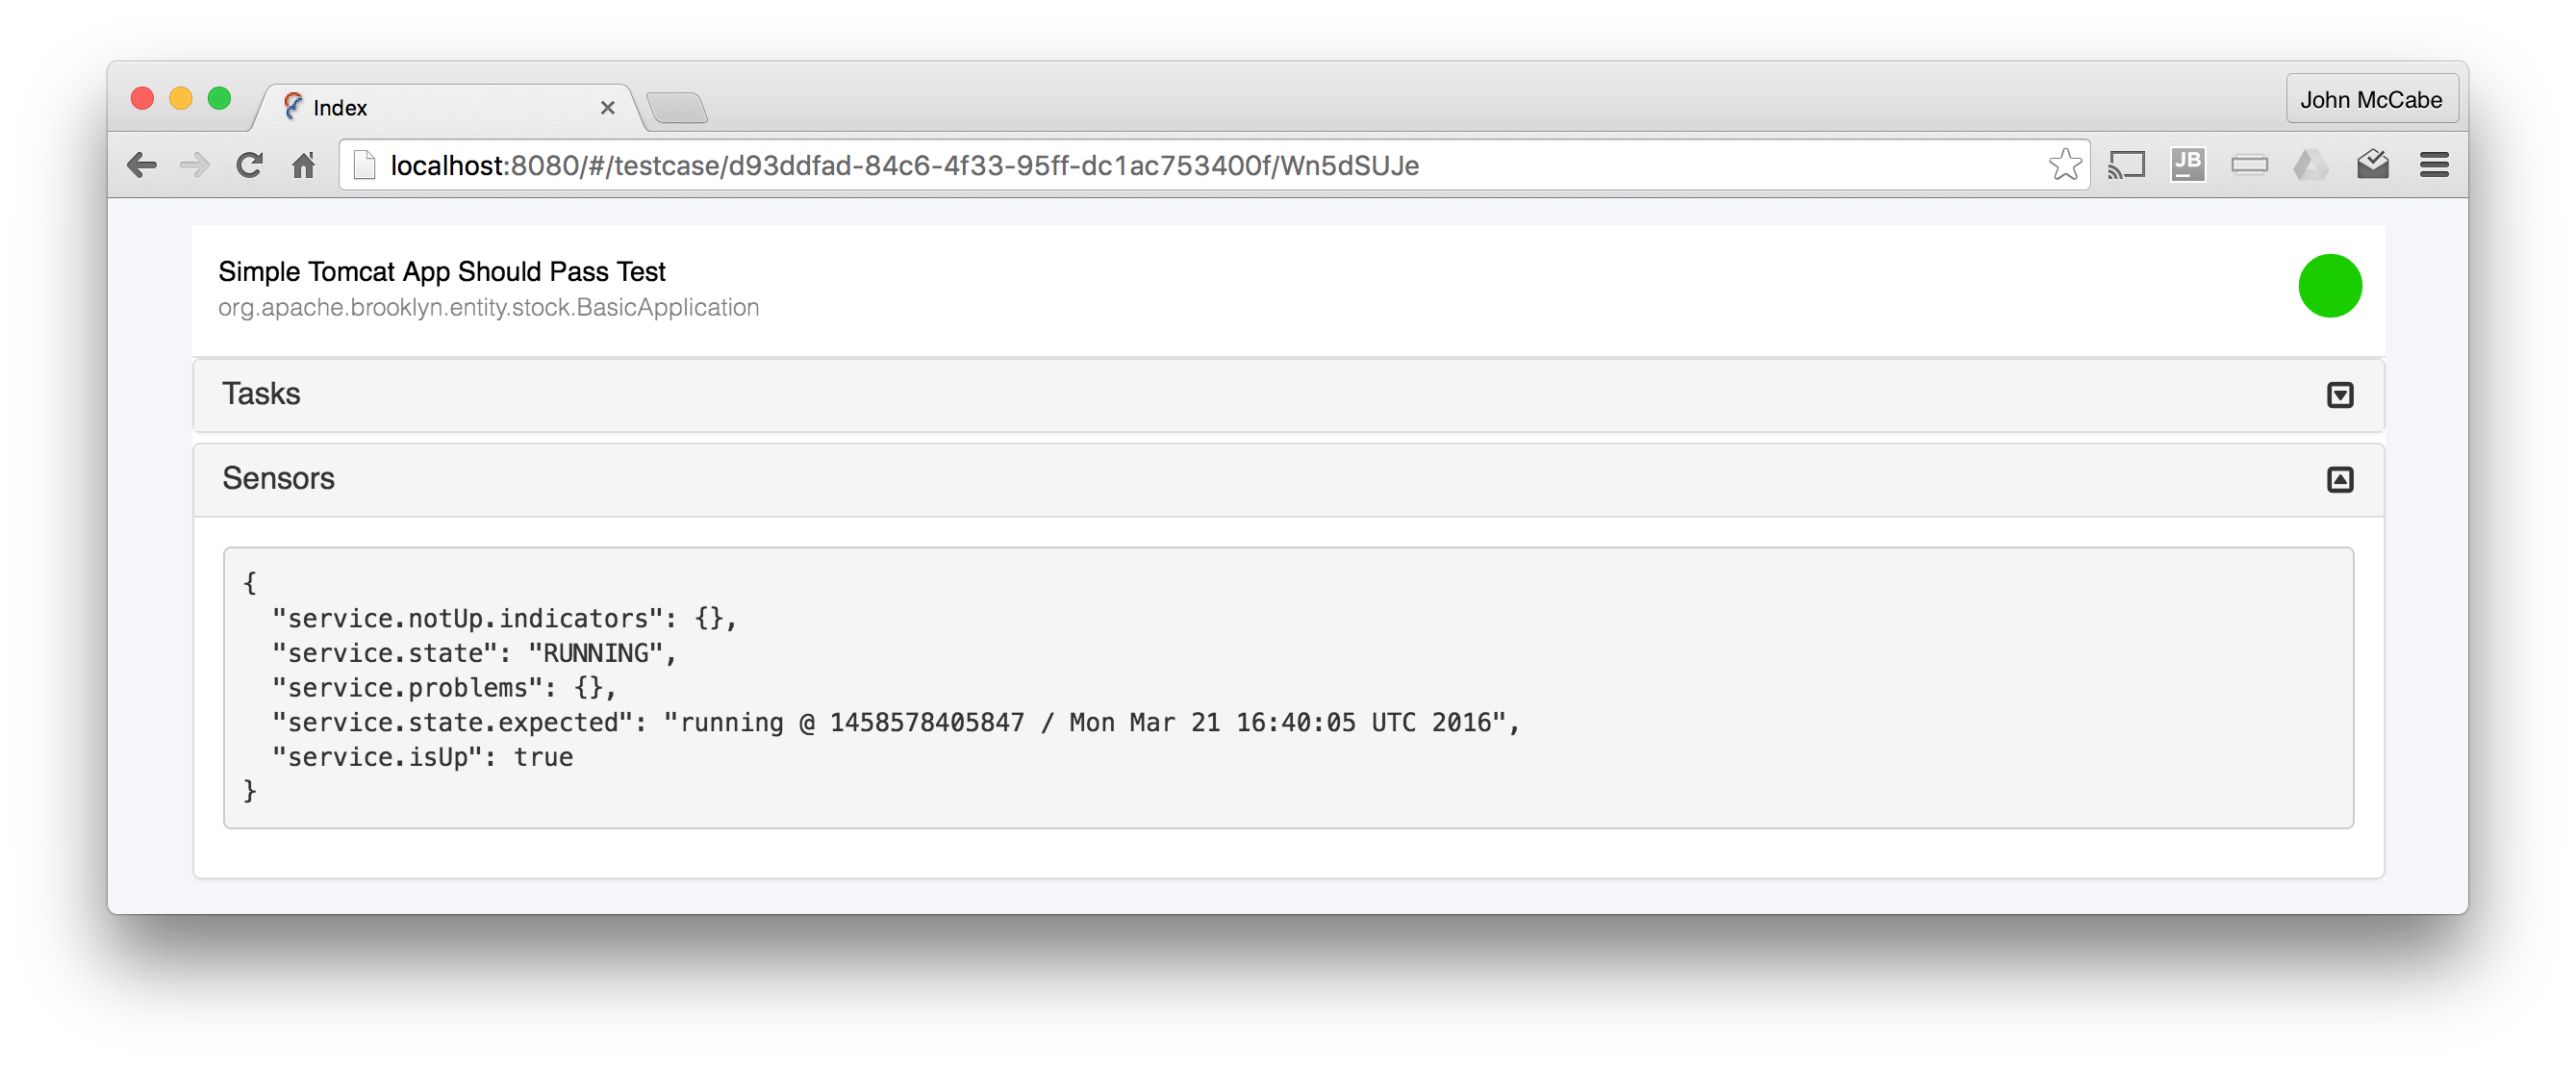
Clicking on the Sensors bar (if present) will display a JSON object containing the sensors associated with the entity.
Summary
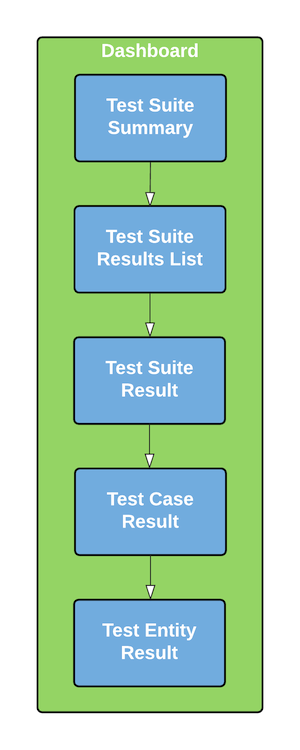
The AMP QA Framework Results dashboard provides a high-level summary of test results. From there, you can filter and drill down through the test suites, cases and entities to the lowest level details: