Troubleshooting: Going Deep in Java and Logs
This guide takes a deep look at the Java and log messages for some failure scenarios, giving common steps used to identify the issues.
Script Failure
Many blueprints run bash scripts as part of the installation. TOSCA nodes are configured using interfaces. Executable artifacts can be attached to operations and run during the application lifecycle.
The tosca-tomcat9-node type that is used in the examples in this section, is declared as shown below:
tosca-tomcat9-node:
    derived_from: tosca.nodes.WebServer
    # properties & attributes omitted for brevity
    interfaces:
      Standard:
        create:
          inputs:
            TOMCAT_gz: { get_property: [ SELF, tomcat.url ] }
          implementation:
            primary: classpath://tomcat9-scripts/tomcat-create.sh
        configure:
          implementation:
            primary: classpath://tomcat9-scripts/tomcat-configure.sh
            dependencies:
            - ROOT_war
        start: classpath://tomcat9-scripts/tomcat-start.sh
        stop: classpath://tomcat9-scripts/tomcat-stop.sh
    artifacts:
      ROOT_war:
        type: tosca.artifacts.File
Each phase of the lifecycle is implemented by a script attached to the operation with the same name. To produce a failure, the tomcat-configure.sh bash script is modified and a code snippet that creates four directories is added, but the command is incorrect.
#!/bin/bash

# the configuration code omitted for brevity

mkrid -p conf logs webapps temp # `mkdir` changed to `mkrid`
The bundle containing the tosca-tomcat9-node type, must be rebuilt and re-added to the catalog. Now let’s try deploying an application this using the following YAML:
tosca_definitions_version: tosca_simple_yaml_1_3
metadata:
  template_name: Tomcat failure test

topology_template:
  node_templates:
    f316eyHX:
      type: tosca-tomcat9-node
      artifacts:
        ROOT_war:
          file: classpath://io.cloudsoft.brooklyn.tosca13.tosca-3-tier:resources/tosca-hello-world-sql-webapp.war
Shortly after deployment, the entity fails with the following error:
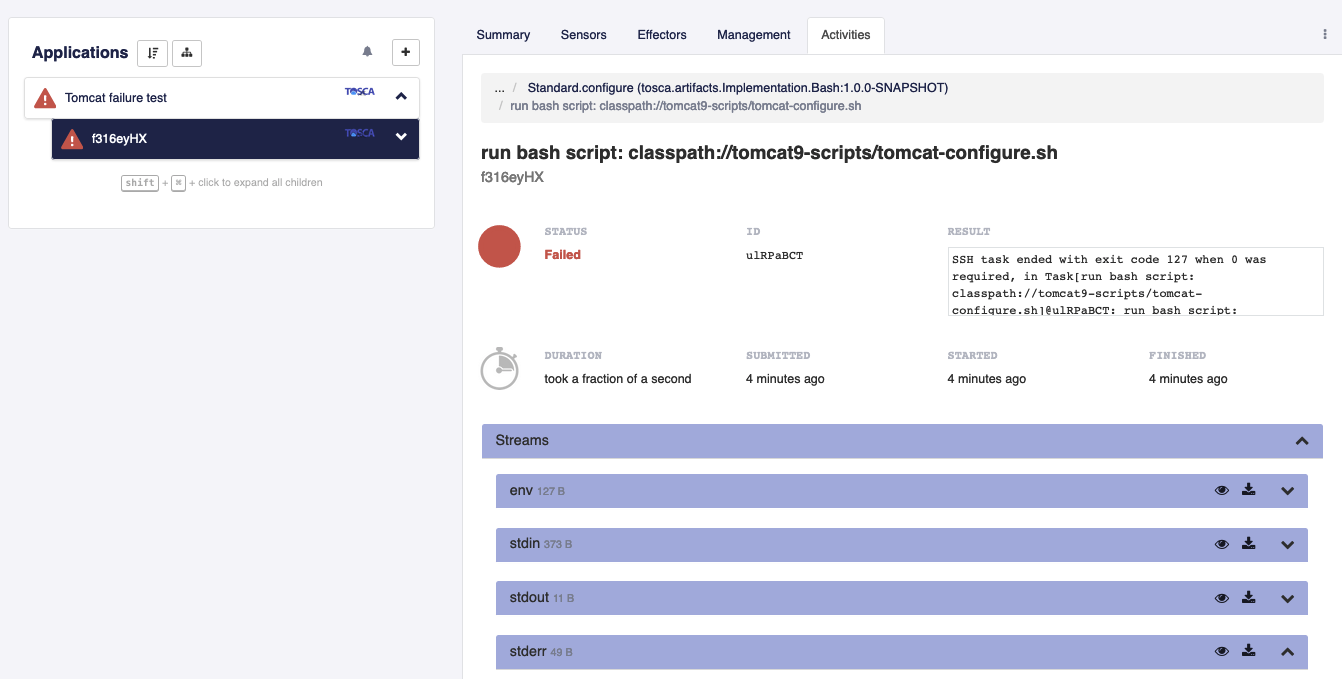
SSH task ended with exit code 127 when 0 was required, in Task[run bash script: classpath://tomcat9-scripts/tomcat-configure.sh]@ulRPaBCT: run bash script: classpath://tomcat9-scripts/tomcat-configure.sh
By expanding the stderr section, we can see the script failed with the following error:
./effector.sh: line 21: mkrid: command not foundThis tells us what went wrong, but doesn’t tell us where. In order to find that, we’ll need to look at the stack trace that was logged when the exception was thrown.
It’s always worth looking at the Detailed Status section as sometimes this will give you the information you need. In this case, the stack trace is limited to the thread that was used to execute the task that ran the script:
STDERR
Failed after 921ms: SSH task ended with exit code 127 when 0 was required, in Task[run bash script: classpath://tomcat9-scripts/tomcat-configure.sh]@ulRPaBCT: run bash script: classpath://tomcat9-scripts/tomcat-configure.sh

STDOUT
java.lang.IllegalStateException: SSH task ended with exit code 127 when 0 was required, in Task[run bash script: classpath://tomcat9-scripts/tomcat-configure.sh]@ulRPaBCT: run bash script: classpath://tomcat9-scripts/tomcat-configure.sh
at org.apache.brooklyn.util.core.task.system.ProcessTaskWrapper$ProcessTaskInternalJob.logWithDetailsAndThrow(ProcessTaskWrapper.java:151)
at org.apache.brooklyn.util.core.task.system.ProcessTaskWrapper$ProcessTaskInternalJob.call(ProcessTaskWrapper.java:125)
at org.apache.brooklyn.util.core.task.BasicExecutionManager$SubmissionCallable.call(BasicExecutionManager.java:874)
at java.util.concurrent.FutureTask.run(FutureTask.java:266)
at java.util.concurrent.ThreadPoolExecutor.runWorker(ThreadPoolExecutor.java:1149)
at java.util.concurrent.ThreadPoolExecutor$Worker.run(ThreadPoolExecutor.java:624)
at java.lang.Thread.run(Thread.java:748)
In order to find the exception, we’ll need to look in AMP’s debug log file. By default, the debug log file is named amp.debug.log. Usually the easiest way to navigate the log file is to use less, e.g. less amp.debug.log. We can quickly find the stack trace by first navigating to the end of the log file with Shift-G, then performing a reverse-lookup by typing ?Tomcat and pressing Enter. If searching for the blueprint type (in this case Tomcat) simply matches tasks unrelated to the exception, you can also search for
the text of the error message, in this case return status 127. You can make the search case-insensitivity by typing -i before performing the search. To skip the current match and move to the next one (i.e. ‘up’ as we’re performing a reverse-lookup), simply press n.
In this case, the ?Tomcat search takes us directly to the full stack trace (Only the last part of the trace is shown here):
Caused by: java.util.concurrent.ExecutionException: org.apache.brooklyn.util.exceptions.PropagatedRuntimeException: Error invoking start at ToscaSoftwareComponentNodeEntityImpl{id=oq7xztoxnm}: Error invoking Standard.configure at ToscaSoftwareComponentNodeEntityImpl{id=oq7xztoxnm}: SSH task ended with exit code 127 when 0 was required, in Task[run bash script: classpath://tomcat9-scripts/tomcat-configure.sh]@ulRPaBCT: run bash script: classpath://tomcat9-scripts/tomcat-configure.sh
        at java.util.concurrent.FutureTask.report(FutureTask.java:122) ~[?:1.8.0_282]
        at java.util.concurrent.FutureTask.get(FutureTask.java:192) ~[?:1.8.0_282]
        at com.google.common.util.concurrent.ForwardingFuture.get(ForwardingFuture.java:63) ~[!/:?]
        at org.apache.brooklyn.util.core.task.BasicTask.get(BasicTask.java:390) ~[?:?]
...
Caused by: java.lang.IllegalStateException: SSH task ended with exit code 127 when 0 was required, in Task[run bash script: classpath://tomcat9-scripts/tomcat-
configure.sh]@ulRPaBCT: run bash script: classpath://tomcat9-scripts/tomcat-configure.sh
        at org.apache.brooklyn.util.core.task.system.ProcessTaskWrapper$ProcessTaskInternalJob.logWithDetailsAndThrow(ProcessTaskWrapper.java:151) ~[?:?]
        at org.apache.brooklyn.util.core.task.system.ProcessTaskWrapper$ProcessTaskInternalJob.call(ProcessTaskWrapper.java:125) ~[?:?]
        ... 5 more
Combining this with the error message of mkrid: command not found we can see that indeed mkdir has been misspelled mkrid on line 21 of classpath://tomcat9-scripts/tomcat-configure.sh executable artifact.
External Failure
Sometimes an entity will fail outside the direct commands issues by AMP. When installing and launching an entity, AMP will check the return code of scripts that were run to ensure that they completed successfully (i.e. the return code of the script is zero). It is possible, for example, that a launch script completes successfully, but the entity fails to start.
We can simulate this type of failure by launching Tomcat without an artifact to deploy. Since the WAR artifact deployed on the Tomcat instance is provided via URL, the easiest way is to modify the url to search for a version of that artifact that does not exist. So changing this URL
http://search.maven.org/remotecontent?filepath=org/apache/brooklyn/example/brooklyn-example-hello-world-sql-webapp/0.9.0/brooklyn-example-hello-world-sql-webapp-0.9.0.war
into
http://search.maven.org/remotecontent?filepath=org/apache/brooklyn/example/brooklyn-example-hello-world-sql-webapp/2.0.0/brooklyn-example-hello-world-sql-webapp-2.0.0.war
Should cause a failure. AMP has no way to know if the artifact is available or not until the tomcat-configure.sh script tries to download it.
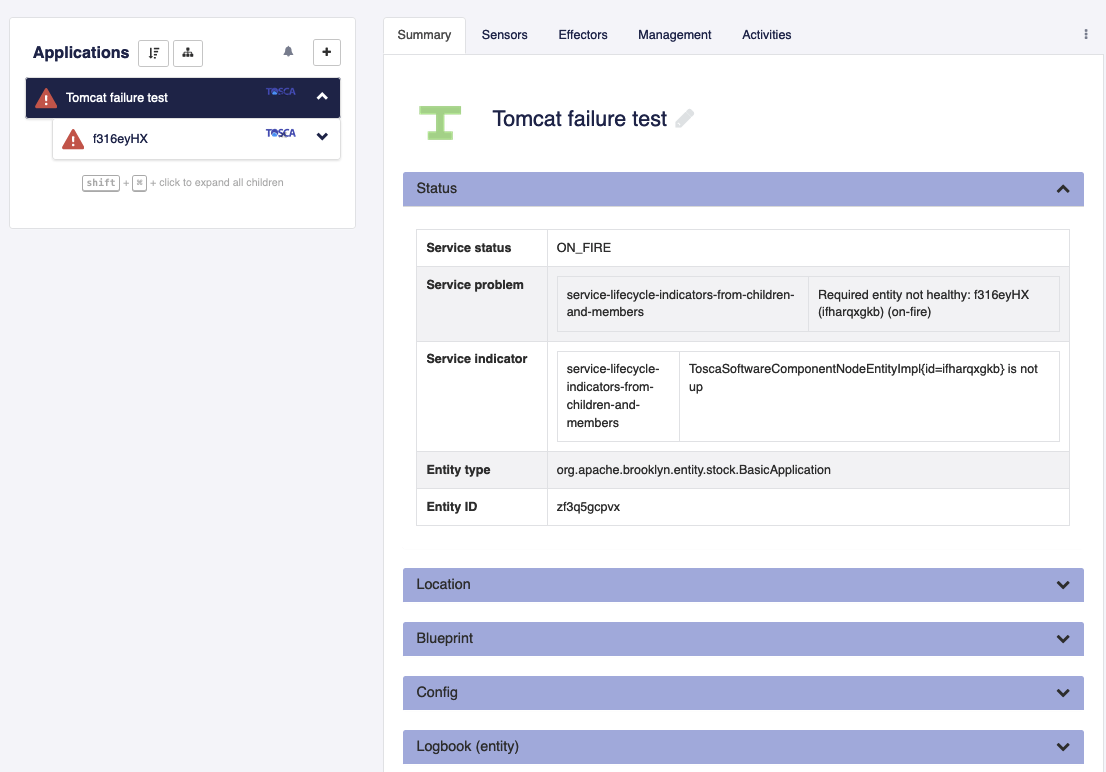
Let’s deploy Tomcat again, using the same YAML as before. This time, the deployment runs for a few minutes before failing
with Required entity not healthy:
If we drill down into the tasks in the Activities tab, we can see that all the tasks up to Standard.configure
completed successfully, and stdout of the tomcat-configure.sh script is as follows:
Error getting resource 'http://search.maven.org/remotecontent?filepath=org/apache/brooklyn/example/brooklyn-example-hello-world-sql-webapp/2.0.0/brooklyn-example-hello-world-sql-webapp-2.0.0.war' for ToscaSoftwareComponentNodeEntityImpl{id=ifharqxgkb}: Invalid response invoking http://search.maven.org/remotecontent?filepath=org/apacheThe Detailed section of the Standard.configure is as follows:
Failed after 1.82s: Error invoking Standard.configure at ToscaSoftwareComponentNodeEntityImpl{id=ifharqxgkb}: Error getting resource 'http://search.maven.org/remotecontent?filepath=org/apache/brooklyn/example/brooklyn-example-hello-world-sql-webapp/2.0.0/brooklyn-example-hello-world-sql-webapp-2.0.0.war' for ToscaSoftwareComponentNodeEntityImpl{id=ifharqxgkb}: Invalid response invoking http://search.maven.org/remotecontent?filepath=org/apache/brooklyn/example/brooklyn-example-hello-world-sql-webapp/2.0.0/brooklyn-example-hello-world-sql-webapp-2.0.0.war: response code 404

org.apache.brooklyn.core.mgmt.internal.EffectorUtils$EffectorCallPropagatedRuntimeException: Error invoking Standard.configure at ToscaSoftwareComponentNodeEntityImpl{id=ifharqxgkb}: Error getting resource 'http://search.maven.org/remotecontent?filepath=org/apache/brooklyn/example/brooklyn-example-hello-world-sql-webapp/2.0.0/brooklyn-example-hello-world-sql-webapp-2.0.0.war' for ToscaSoftwareComponentNodeEntityImpl{id=ifharqxgkb}: Invalid response invoking http://search.maven.org/remotecontent?filepath=org/apache/brooklyn/example/brooklyn-example-hello-world-sql-webapp/2.0.0/brooklyn-example-hello-world-sql-webapp-2.0.0.war: response code 404
	at org.apache.brooklyn.core.mgmt.internal.EffectorUtils$EffectorCallPropagatedRuntimeException.propagate(EffectorUtils.java:316)
	at org.apache.brooklyn.core.mgmt.internal.EffectorUtils$EffectorCallPropagatedRuntimeException.access$100(EffectorUtils.java:283)
	at org.apache.brooklyn.core.mgmt.internal.EffectorUtils.handleEffectorException(EffectorUtils.java:324)
	at org.apache.brooklyn.core.effector.EffectorTasks$EffectorBodyTaskFactory$2.handleException(EffectorTasks.java:90)
	at org.apache.brooklyn.util.core.task.DynamicSequentialTask.handleException(DynamicSequentialTask.java:480)
	at org.apache.brooklyn.util.core.task.DynamicSequentialTask$DstJob.call(DynamicSequentialTask.java:428)
	at org.apache.brooklyn.util.core.task.BasicExecutionManager$SubmissionCallable.call(BasicExecutionManager.java:874)
	at java.util.concurrent.FutureTask.run(FutureTask.java:266)
	at java.util.concurrent.ThreadPoolExecutor.runWorker(ThreadPoolExecutor.java:1149)
	at java.util.concurrent.ThreadPoolExecutor$Worker.run(ThreadPoolExecutor.java:624)
	at java.lang.Thread.run(Thread.java:748)
Caused by: org.apache.brooklyn.util.exceptions.PropagatedRuntimeException: Error getting resource 'http://search.maven.org/remotecontent?filepath=org/apache/brooklyn/example/brooklyn-example-hello-world-sql-webapp/2.0.0/brooklyn-example-hello-world-sql-webapp-2.0.0.war' for ToscaSoftwareComponentNodeEntityImpl{id=ifharqxgkb}: Invalid response invoking http://search.maven.org/remotecontent?filepath=org/apache/brooklyn/example/brooklyn-example-hello-world-sql-webapp/2.0.0/brooklyn-example-hello-world-sql-webapp-2.0.0.war: response code 404
	at org.apache.brooklyn.util.exceptions.Exceptions.propagate(Exceptions.java:129)
	at org.apache.brooklyn.util.core.task.BasicTask.getUnchecked(BasicTask.java:401)
	at org.apache.brooklyn.core.effector.EffectorTasks$EffectorMarkingTaskFactory$1.call(EffectorTasks.java:128)
	at org.apache.brooklyn.core.effector.EffectorTasks$EffectorBodyTaskFactory$1.call(EffectorTasks.java:82)
	at org.apache.brooklyn.util.core.task.DynamicSequentialTask$DstJob.call(DynamicSequentialTask.java:370)
	... 5 more
...
Caused by: java.lang.IllegalStateException: Invalid response invoking http://search.maven.org/remotecontent?filepath=org/apache/brooklyn/example/brooklyn-example-hello-world-sql-webapp/2.0.0/brooklyn-example-hello-world-sql-webapp-2.0.0.war: response code 404
	at org.apache.brooklyn.util.core.ResourceUtils.getResourceViaHttp(ResourceUtils.java:476)
	at org.apache.brooklyn.util.core.ResourceUtils.getResourceFromUrl(ResourceUtils.java:282)
	... 23 more
The stacktrace is quite readable and points to the real problem.
Many blueprints run bash scripts as part of the installation. This section highlights how to identify a problem with a bash script.
First let’s take a look at the customize() method of the Tomcat server blueprint:
@Override
public void customize() {
newScript(CUSTOMIZING)
.body.append("mkdir -p conf logs webapps temp")
.failOnNonZeroResultCode()
.execute();

    copyTemplate(entity.getConfig(TomcatServer.SERVER_XML_RESOURCE), Os.mergePaths(getRunDir(), "conf", "server.xml"));
    copyTemplate(entity.getConfig(TomcatServer.WEB_XML_RESOURCE), Os.mergePaths(getRunDir(), "conf", "web.xml"));

    if (isProtocolEnabled("HTTPS")) {
        String keystoreUrl = Preconditions.checkNotNull(getSslKeystoreUrl(), "keystore URL must be specified if using HTTPS for " + entity);
        String destinationSslKeystoreFile = getHttpsSslKeystoreFile();
        InputStream keystoreStream = resource.getResourceFromUrl(keystoreUrl);
        getMachine().copyTo(keystoreStream, destinationSslKeystoreFile);
    }

    getEntity().deployInitialWars();
}
Here we can see that it’s running a script to create four directories before continuing with the customization. Let’s
introduce an error by changing mkdir to mkrid:
newScript(CUSTOMIZING)
.body.append("mkrid -p conf logs webapps temp") // `mkdir` changed to `mkrid`
.failOnNonZeroResultCode()
.execute();
Now let’s try deploying this using the following YAML:
name: Tomcat failure test
location: localhost
services:
- type: org.apache.brooklyn.entity.webapp.tomcat.TomcatServer
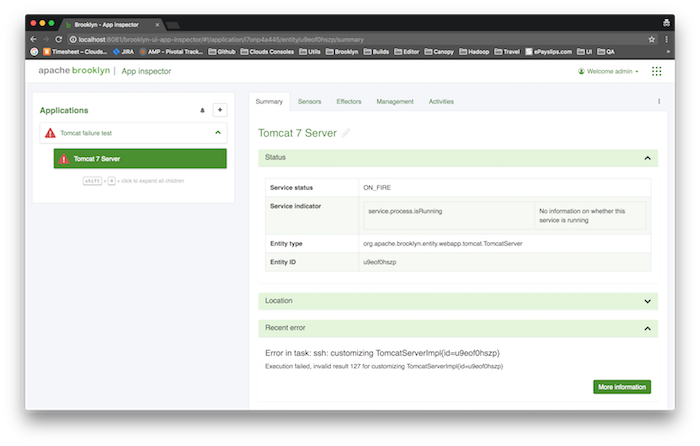
Shortly after deployment, the entity fails with the following error:
Error in task: ssh: customizing TomcatServerImpl{id=u9eof0hszp}
Execution failed, invalid result 127 for customizing TomcatServerImpl{id=u9eof0hszp}
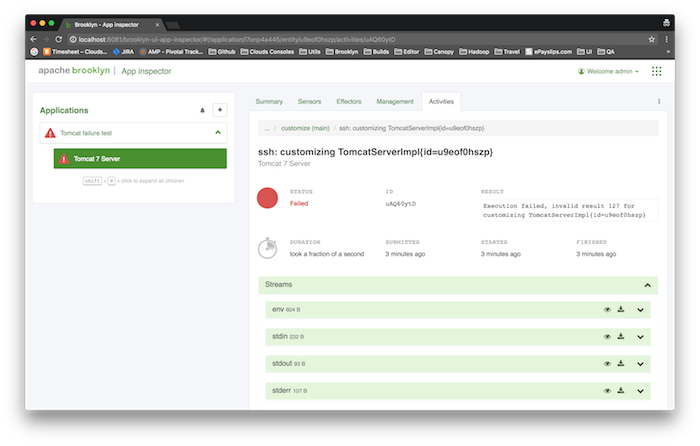
We can drill into the task that failed, directly by clicking the “More information” button or by selecting the Activities tab:
the list of tasks shown (where the effectors are shown as top-level tasks) are clickable links. Selecting that row will show the details of
that particular task, including its sub-tasks. We can eventually get to the specific sub-task that failed:
By expanding the stderr section, we can see the script failed with the following error:
/tmp/brooklyn-20150721-132251052-l4b9-customizing_TomcatServerImpl_i.sh: line 10: mkrid: command not foundThis tells us what went wrong, but doesn’t tell us where. In order to find that, we’ll need to look at the stack trace that was logged when the exception was thrown.
It’s always worth looking at the Detailed Status section as sometimes this will give you the information you need. In this case, the stack trace is limited to the thread that was used to execute the task that ran the script:
Failed after 40ms

STDERR
/tmp/brooklyn-20180720-121710003-Qh8k-customizing_TomcatServerImpl_i.sh: line 11: mkrid: command not found

STDOUT
Executed /tmp/brooklyn-20180720-121710003-Qh8k-customizing_TomcatServerImpl_i.sh, result 127: Execution failed, invalid result 127 for customizing TomcatServerImpl{id=u9eof0hszp}

java.lang.IllegalStateException: Execution failed, invalid result 127 for customizing TomcatServerImpl{id=e1HP2s8x}
at org.apache.brooklyn.entity.software.base.lifecycle.ScriptHelper.logWithDetailsAndThrow(ScriptHelper.java:390)
at org.apache.brooklyn.entity.software.base.lifecycle.ScriptHelper.executeInternal(ScriptHelper.java:379)
at org.apache.brooklyn.entity.software.base.lifecycle.ScriptHelper$8.call(ScriptHelper.java:289)
at org.apache.brooklyn.entity.software.base.lifecycle.ScriptHelper$8.call(ScriptHelper.java:287)
at org.apache.brooklyn.core.util.task.DynamicSequentialTask$DstJob.call(DynamicSequentialTask.java:343)
at org.apache.brooklyn.core.util.task.BasicExecutionManager$SubmissionCallable.call(BasicExecutionManager.java:469)
at java.util.concurrent.FutureTask.run(FutureTask.java:262)
at java.util.concurrent.ThreadPoolExecutor.runWorker(ThreadPoolExecutor.java:1145)
at java.util.concurrent.ThreadPoolExecutor$Worker.run(ThreadPoolExecutor.java:615)
at java.lang.Thread.run(Thread.java:745)
In order to find the exception, we’ll need to look in AMP’s debug log file. By default, the debug log file
is named brooklyn.debug.log. Usually the easiest way to navigate the log file is to use less, e.g.
less brooklyn.debug.log. We can quickly find the stack trace by first navigating to the end of the log file
with Shift-G, then performing a reverse-lookup by typing ?Tomcat and pressing Enter. If searching for the
blueprint type (in this case Tomcat) simply matches tasks unrelated to the exception, you can also search for
the text of the error message, in this case ? invalid result 127. You can make the search case-insensitivity by
typing -i before performing the search. To skip the current match and move to the next one (i.e. ‘up’ as we’re
performing a reverse-lookup), simply press n
In this case, the ?Tomcat search takes us directly to the full stack trace (Only the last part of the trace
is shown here):
... at com.google.common.util.concurrent.ForwardingFuture.get(ForwardingFuture.java:63) ~[guava-17.0.jar:na]
at org.apache.brooklyn.core.util.task.BasicTask.get(BasicTask.java:343) ~[classes/:na]
at org.apache.brooklyn.core.util.task.BasicTask.getUnchecked(BasicTask.java:352) ~[classes/:na]
... 9 common frames omitted
Caused by: brooklyn.util.exceptions.PropagatedRuntimeException:
at org.apache.brooklyn.util.exceptions.Exceptions.propagate(Exceptions.java:97) ~[classes/:na]
at org.apache.brooklyn.core.util.task.BasicTask.getUnchecked(BasicTask.java:354) ~[classes/:na]
at org.apache.brooklyn.entity.software.base.lifecycle.ScriptHelper.execute(ScriptHelper.java:339) ~[classes/:na]
at org.apache.brooklyn.entity.webapp.tomcat.TomcatSshDriver.customize(TomcatSshDriver.java:72) ~[classes/:na]
at org.apache.brooklyn.entity.software.base.AbstractSoftwareProcessDriver$8.run(AbstractSoftwareProcessDriver.java:150) ~[classes/:na]
at java.util.concurrent.Executors$RunnableAdapter.call(Executors.java:471) ~[na:1.7.0_71]
at org.apache.brooklyn.core.util.task.DynamicSequentialTask$DstJob.call(DynamicSequentialTask.java:343) ~[classes/:na]
... 5 common frames omitted
Caused by: java.util.concurrent.ExecutionException: java.lang.IllegalStateException: Execution failed, invalid result 127 for customizing TomcatServerImpl{id=e1HP2s8x}
at java.util.concurrent.FutureTask.report(FutureTask.java:122) [na:1.7.0_71]
at java.util.concurrent.FutureTask.get(FutureTask.java:188) [na:1.7.0_71]
at com.google.common.util.concurrent.ForwardingFuture.get(ForwardingFuture.java:63) ~[guava-17.0.jar:na]
at org.apache.brooklyn.core.util.task.BasicTask.get(BasicTask.java:343) ~[classes/:na]
at org.apache.brooklyn.core.util.task.BasicTask.getUnchecked(BasicTask.java:352) ~[classes/:na]
... 10 common frames omitted
Caused by: java.lang.IllegalStateException: Execution failed, invalid result 127 for customizing TomcatServerImpl{id=e1HP2s8x}
at org.apache.brooklyn.entity.software.base.lifecycle.ScriptHelper.logWithDetailsAndThrow(ScriptHelper.java:390) ~[classes/:na]
at org.apache.brooklyn.entity.software.base.lifecycle.ScriptHelper.executeInternal(ScriptHelper.java:379) ~[classes/:na]
at org.apache.brooklyn.entity.software.base.lifecycle.ScriptHelper$8.call(ScriptHelper.java:289) ~[classes/:na]
at org.apache.brooklyn.entity.software.base.lifecycle.ScriptHelper$8.call(ScriptHelper.java:287) ~[classes/:na]
... 6 common frames omitted
AMP’s use of tasks and helper classes can make the stack trace a little harder than usual to follow, but a good
place to start is to look through the stack trace for the node’s implementation or ssh driver classes (usually
named FooNodeImpl or FooSshDriver). In this case we can see the following:
at org.apache.brooklyn.entity.webapp.tomcat.TomcatSshDriver.customize(TomcatSshDriver.java:72) ~[classes/:na]Combining this with the error message of mkrid: command not found we can see that indeed mkdir has been
misspelled mkrid on line 72 of TomcatSshDriver.java.
Non-Script Failure
The section above gives an example of a failure that occurs when a script is run. In this section we will look at
a failure in a non-script related part of the code. We’ll use the customize() method of the Tomcat server again,
but this time, we’ll correct the spelling of ‘mkdir’ and add a line that attempts to copy a nonexistent resource
to the remote server:
newScript(CUSTOMIZING)
.body.append("mkdir -p conf logs webapps temp")
.failOnNonZeroResultCode()
.execute();

copyTemplate(entity.getConfig(TomcatServer.SERVER_XML_RESOURCE), Os.mergePaths(getRunDir(), "conf", "server.xml"));
copyTemplate(entity.getConfig(TomcatServer.WEB_XML_RESOURCE), Os.mergePaths(getRunDir(), "conf", "web.xml"));
copyTemplate("classpath://nonexistent.xml", Os.mergePaths(getRunDir(), "conf", "nonexistent.xml")); // Resource does not exist!
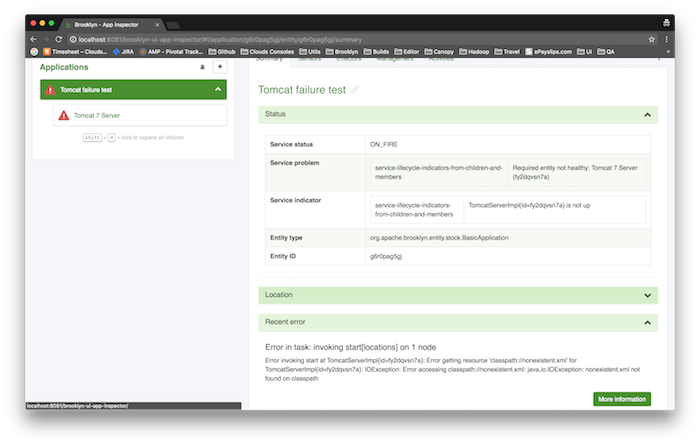
Let’s deploy this using the same YAML from above. Here’s the resulting error in the AMP debug console:
Again, this tells us what the error is, but we need to find where the code is that attempts to copy this file. In this case it’s shown in the Detailed Status section, and we don’t need to go to the log file:
Failed after 221ms: Error getting resource 'classpath://nonexistent.xml' for TomcatServerImpl{id=PVZxDKU1}: java.io.IOException: Error accessing classpath://nonexistent.xml: java.io.IOException: nonexistent.xml not found on classpath

java.lang.RuntimeException: Error getting resource 'classpath://nonexistent.xml' for TomcatServerImpl{id=PVZxDKU1}: java.io.IOException: Error accessing classpath://nonexistent.xml: java.io.IOException: nonexistent.xml not found on classpath
at org.apache.brooklyn.core.util.ResourceUtils.getResourceFromUrl(ResourceUtils.java:297)
at org.apache.brooklyn.core.util.ResourceUtils.getResourceAsString(ResourceUtils.java:475)
at org.apache.brooklyn.entity.software.base.AbstractSoftwareProcessDriver.getResourceAsString(AbstractSoftwareProcessDriver.java:447)
at org.apache.brooklyn.entity.software.base.AbstractSoftwareProcessDriver.processTemplate(AbstractSoftwareProcessDriver.java:469)
at org.apache.brooklyn.entity.software.base.AbstractSoftwareProcessDriver.copyTemplate(AbstractSoftwareProcessDriver.java:390)
at org.apache.brooklyn.entity.software.base.AbstractSoftwareProcessDriver.copyTemplate(AbstractSoftwareProcessDriver.java:379)
at org.apache.brooklyn.entity.webapp.tomcat.TomcatSshDriver.customize(TomcatSshDriver.java:79)
at org.apache.brooklyn.entity.software.base.AbstractSoftwareProcessDriver$8.run(AbstractSoftwareProcessDriver.java:150)
at java.util.concurrent.Executors$RunnableAdapter.call(Executors.java:471)
at org.apache.brooklyn.core.util.task.DynamicSequentialTask$DstJob.call(DynamicSequentialTask.java:343)
at org.apache.brooklyn.core.util.task.BasicExecutionManager$SubmissionCallable.call(BasicExecutionManager.java:469)
at java.util.concurrent.FutureTask.run(FutureTask.java:262)
at java.util.concurrent.ThreadPoolExecutor.runWorker(ThreadPoolExecutor.java:1145)
at java.util.concurrent.ThreadPoolExecutor$Worker.run(ThreadPoolExecutor.java:615)
at java.lang.Thread.run(Thread.java:745)
Caused by: java.io.IOException: Error accessing classpath://nonexistent.xml: java.io.IOException: nonexistent.xml not found on classpath
at org.apache.brooklyn.core.util.ResourceUtils.getResourceFromUrl(ResourceUtils.java:233)
... 14 more
Caused by: java.io.IOException: nonexistent.xml not found on classpath
at org.apache.brooklyn.core.util.ResourceUtils.getResourceViaClasspath(ResourceUtils.java:372)
at org.apache.brooklyn.core.util.ResourceUtils.getResourceFromUrl(ResourceUtils.java:230)
... 14 more
Looking for Tomcat in the stack trace, we can see in this case the problem lies at line 79 of TomcatSshDriver.java
External Failure
Sometimes an entity will fail outside the direct commands issues by AMP. When installing and launching an entity, AMP will check the return code of scripts that were run to ensure that they completed successfully (i.e. the return code of the script is zero). It is possible, for example, that a launch script completes successfully, but the entity fails to start.
We can simulate this type of failure by launching Tomcat with an invalid configuration file. As seen in the previous
examples, AMP copies two xml configuration files to the server: server.xml and web.xml
The first few non-comment lines of server.xml:
<Server port="${driver.shutdownPort?c}" shutdown="SHUTDOWN">
     <Listener className="org.apache.catalina.core.AprLifecycleListener" SSLEngine="on" />
     <Listener className="org.apache.catalina.core.JasperListener" />
Let’s add an unmatched XML element, which will make this XML file invalid:
<Server port="${driver.shutdownPort?c}" shutdown="SHUTDOWN">
     <unmatched-element> <!-- This is invalid XML as we won't add </unmatched-element> -->
     <Listener className="org.apache.catalina.core.AprLifecycleListener" SSLEngine="on" />
     <Listener className="org.apache.catalina.core.JasperListener" />
As AMP doesn’t know how these types of resources are used, they’re not validated as they’re copied to the remote machine. As far as AMP is concerned, the file will have copied successfully.
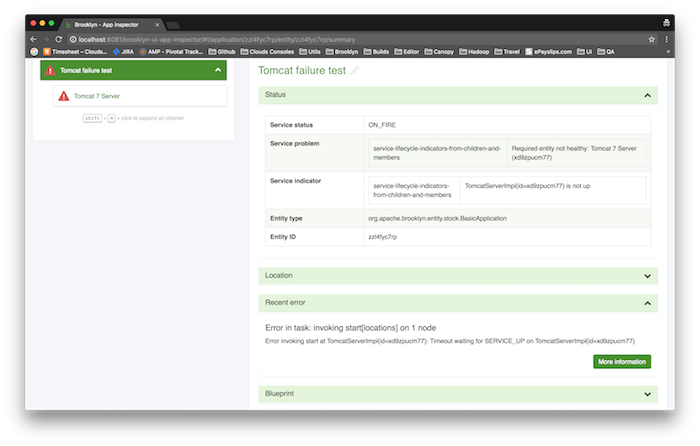
Let’s deploy Tomcat again, using the same YAML as before. This time, the deployment runs for a few minutes before failing
with Timeout waiting for SERVICE_UP:
If we drill down into the tasks in the Activities tab, we can see that all of the installation and launch tasks
completed successfully, and stdout of the launch script is as follows:
Executed /tmp/brooklyn-20150721-153049139-fK2U-launching_TomcatServerImpl_id_.sh, result 0The task that failed was the post-start task, and the stack trace from the Detailed Status section is as follows:
Failed after 5m 1s: Timeout waiting for SERVICE_UP from TomcatServerImpl{id=BUHgQeOs}

java.lang.IllegalStateException: Timeout waiting for SERVICE_UP from TomcatServerImpl{id=BUHgQeOs}
at org.apache.brooklyn.core.entity.Entities.waitForServiceUp(Entities.java:1073)
at org.apache.brooklyn.entity.software.base.SoftwareProcessImpl.waitForServiceUp(SoftwareProcessImpl.java:388)
at org.apache.brooklyn.entity.software.base.SoftwareProcessImpl.waitForServiceUp(SoftwareProcessImpl.java:385)
at org.apache.brooklyn.entity.software.base.SoftwareProcessDriverLifecycleEffectorTasks.postStartCustom(SoftwareProcessDriverLifecycleEffectorTasks.java:164)
at org.apache.brooklyn.entity.software.base.lifecycle.MachineLifecycleEffectorTasks$7.run(MachineLifecycleEffectorTasks.java:433)
at java.util.concurrent.Executors$RunnableAdapter.call(Executors.java:471)
at org.apache.brooklyn.core.util.task.DynamicSequentialTask$DstJob.call(DynamicSequentialTask.java:343)
at org.apache.brooklyn.core.util.task.BasicExecutionManager$SubmissionCallable.call(BasicExecutionManager.java:469)
at java.util.concurrent.FutureTask.run(FutureTask.java:262)
at java.util.concurrent.ThreadPoolExecutor.runWorker(ThreadPoolExecutor.java:1145)
at java.util.concurrent.ThreadPoolExecutor$Worker.run(ThreadPoolExecutor.java:615)
at java.lang.Thread.run(Thread.java:745)
This doesn’t really tell us what we need to know, and looking in the brooklyn.debug.log file yields no further
clues. The key here is the error message Timeout waiting for SERVICE_UP. After running the installation and
launch scripts, assuming all scripts completed successfully, AMP will periodically check the health of the node
and will set the node on fire if the health check does not pass within a pre-prescribed period (the default is
two minutes, and can be configured using the start.timeout config key). The periodic health check also continues
after the successful launch in order to check continued operation of the node, but in this case it fails to pass
at all.
The first thing we need to do is to find out how AMP determines the health of the node. The health-check is
often implemented in the isRunning() method in the entity’s ssh driver. Tomcat’s implementation of isRunning()
is as follows:
@Override
public boolean isRunning() {
return newScript(MutableMap.of(USE_PID_FILE, "pid.txt"), CHECK_RUNNING).execute() == 0;
}
The newScript method has conveniences for default scripts to check if a process is running based on its PID. In this
case, it will look for Tomcat’s PID in the pid.txt file and check if the PID is the PID of a running process
It’s worth a quick sanity check at this point to check if the PID file exists, and if the process is running.
By default, the pid file is located in the run directory of the entity. You can find the location of the entity’s run
directory by looking at the run.dir sensor. In this case it is /tmp/brooklyn-martin/apps/jIzIHXtP/entities/TomcatServer_BUHgQeOs.
To find the pid, you simply cat the pid.txt file in this directory:
$ cat /tmp/brooklyn-martin/apps/jIzIHXtP/entities/TomcatServer_BUHgQeOs/pid.txt
73714
In this case, the PID in the file is 73714. You can then check if the process is running using ps. You can also
pipe the output to fold so the full launch command is visible:
$ ps -p 73714 | fold -w 120
PID TTY           TIME CMD
73714 ??         0:08.03 /Library/Java/JavaVirtualMachines/jdk1.8.0_51.jdk/Contents/Home/bin/java -Dnop -Djava.util.logg
ing.manager=org.apache.juli.ClassLoaderLogManager -javaagent:/tmp/brooklyn-martin/apps/jIzIHXtP/entities/TomcatServer_BU
HgQeOs/brooklyn-jmxmp-agent-shaded-0.8.0-SNAPSHOT.jar -Xms200m -Xmx800m -XX:MaxPermSize=400m -Dcom.sun.management.jmxrem
ote -Dbrooklyn.jmxmp.rmi-port=1099 -Dbrooklyn.jmxmp.port=31001 -Dcom.sun.management.jmxremote.ssl=false -Dcom.sun.manage
ment.jmxremote.authenticate=false -Djava.endorsed.dirs=/tmp/brooklyn-martin/installs/TomcatServer_7.0.56/apache-tomcat-7
.0.56/endorsed -classpath /tmp/brooklyn-martin/installs/TomcatServer_7.0.56/apache-tomcat-7.0.56/bin/bootstrap.jar:/tmp/
brooklyn-martin/installs/TomcatServer_7.0.56/apache-tomcat-7.0.56/bin/tomcat-juli.jar -Dcatalina.base=/tmp/brooklyn-mart
in/apps/jIzIHXtP/entities/TomcatServer_BUHgQeOs -Dcatalina.home=/tmp/brooklyn-martin/installs/TomcatServer_7.0.56/apache
-tomcat-7.0.56 -Djava.io.tmpdir=/tmp/brooklyn-martin/apps/jIzIHXtP/entities/TomcatServer_BUHgQeOs/temp org.apache.catali
na.startup.Bootstrap start
This confirms that the process is running. The next thing we can look at is the service.notUp.indicators sensor. This
reads as follows:
{"service.process.isRunning":"The software process for this entity does not appear to be running"}This confirms that the problem is indeed due to the service.process.isRunning sensor. We assumed earlier that this was
set by the isRunning() method in TomcatSshDriver.java, but this isn’t always the case. The service.process.isRunning
sensor is wired up by the connectSensors() method in the node’s implementation class, in this case
TomcatServerImpl.java. Tomcat’s implementation of connectSensors() is as follows:
@Override
public void connectSensors() {
super.connectSensors();

    if (getDriver().isJmxEnabled()) {
        String requestProcessorMbeanName = "Catalina:type=GlobalRequestProcessor,name=\"http-*\"";

        Integer port = isHttpsEnabled() ? getAttribute(HTTPS_PORT) : getAttribute(HTTP_PORT);
        String connectorMbeanName = format("Catalina:type=Connector,port=%s", port);

        jmxWebFeed = JmxFeed.builder()
            .entity(this)
            .period(3000, TimeUnit.MILLISECONDS)
            .pollAttribute(new JmxAttributePollConfig<Integer>(ERROR_COUNT)
                    .objectName(requestProcessorMbeanName)
                    .attributeName("errorCount"))
            .pollAttribute(new JmxAttributePollConfig<Integer>(REQUEST_COUNT)
                    .objectName(requestProcessorMbeanName)
                    .attributeName("requestCount"))
            .pollAttribute(new JmxAttributePollConfig<Integer>(TOTAL_PROCESSING_TIME)
                    .objectName(requestProcessorMbeanName)
                    .attributeName("processingTime"))
            .pollAttribute(new JmxAttributePollConfig<String>(CONNECTOR_STATUS)
                    .objectName(connectorMbeanName)
                    .attributeName("stateName"))
            .pollAttribute(new JmxAttributePollConfig<Boolean>(SERVICE_PROCESS_IS_RUNNING)
                    .objectName(connectorMbeanName)
                    .attributeName("stateName")
                    .onSuccess(Functions.forPredicate(Predicates.<Object>equalTo("STARTED")))
                    .setOnFailureOrException(false))
            .build();

        jmxAppFeed = JavaAppUtils.connectMXBeanSensors(this);
    } else {
        // if not using JMX
        LOG.warn("Tomcat running without JMX monitoring; limited visibility of service available");
        connectServiceUpIsRunning();
    }
}
We can see here that if jmx is not enabled, the method will call connectServiceUpIsRunning() which will use the
default PID-based method of determining if a process is running. However, as JMX is running, the service.process.isRunning
sensor (denoted here by the SERVICE_PROCESS_IS_RUNNING variable) is set to true if and only if the
stateName JMX attribute equals STARTED. We can see from the previous call to .pollAttribute that this
attribute is also published to the CONNECTOR_STATUS sensor. The CONNECTOR_STATUS sensor is defined as follows:
AttributeSensor<String> CONNECTOR_STATUS =
new BasicAttributeSensor<String>(String.class, "webapp.tomcat.connectorStatus", "Catalina connector state name");
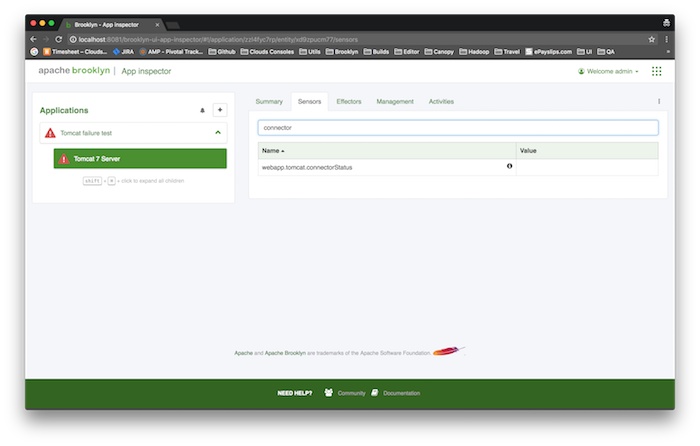
Let’s go back to the AMP debug console and look for the webapp.tomcat.connectorStatus:
The sensor value is null or not set. We know from previous steps that the installation and launch scripts completed, and we know the procecess is running, but we can see here that the server is not responding to JMX requests. A good thing to check here would be that the JMX port is not being blocked by iptables, firewalls or security groups (see the troubleshooting connectivity guide). Let’s assume that we’ve checked that and they’re all open. There is still one more thing that AMP can tell us.
Still on the Sensors tab, let’s take a look at the log.location sensor:
/tmp/brooklyn-martin/apps/c3bmrlC3/entities/TomcatServer_C1TAjYia/logs/catalina.outThis is the location of Tomcat’s own log file. The location of the log file will differ from process to process
and when writing a custom entity you will need to check the software’s own documentation. If your blueprint’s
ssh driver extends JavaSoftwareProcessSshDriver, the value returned by the getLogFileLocation() method will
automatically be published to the log.location sensor. Otherwise, you can publish the value yourself by calling
entity.setAttribute(Attributes.LOG_FILE_LOCATION, getLogFileLocation()); in your ssh driver
Note: The log file will be on the server to which you have deployed Tomcat, and not on the AMP server. Let’s take a look in the log file:
$ less /tmp/brooklyn-martin/apps/c3bmrlC3/entities/TomcatServer_C1TAjYia/logs/catalina.out

Jul 21, 2015 4:12:12 PM org.apache.tomcat.util.digester.Digester fatalError
SEVERE: Parse Fatal Error at line 143 column 3: The element type "unmatched-element" must be terminated by the matching end-tag "</unmatched-element>".
org.xml.sax.SAXParseException; systemId: file:/tmp/brooklyn-martin/apps/c3bmrlC3/entities/TomcatServer_C1TAjYia/conf/server.xml; lineNumber: 143; columnNumber: 3; The element type "unmatched-element" must be terminated by the matching end-tag "</unmatched-element>".
at com.sun.org.apache.xerces.internal.util.ErrorHandlerWrapper.createSAXParseException(ErrorHandlerWrapper.java:203)
at com.sun.org.apache.xerces.internal.util.ErrorHandlerWrapper.fatalError(ErrorHandlerWrapper.java:177)
at com.sun.org.apache.xerces.internal.impl.XMLErrorReporter.reportError(XMLErrorReporter.java:441)
at com.sun.org.apache.xerces.internal.impl.XMLErrorReporter.reportError(XMLErrorReporter.java:368)
at com.sun.org.apache.xerces.internal.impl.XMLScanner.reportFatalError(XMLScanner.java:1437)
at com.sun.org.apache.xerces.internal.impl.XMLDocumentFragmentScannerImpl.scanEndElement(XMLDocumentFragmentScannerImpl.java:1749)
at com.sun.org.apache.xerces.internal.impl.XMLDocumentFragmentScannerImpl$FragmentContentDriver.next(XMLDocumentFragmentScannerImpl.java:2973)
at com.sun.org.apache.xerces.internal.impl.XMLDocumentScannerImpl.next(XMLDocumentScannerImpl.java:606)
at com.sun.org.apache.xerces.internal.impl.XMLDocumentFragmentScannerImpl.scanDocument(XMLDocumentFragmentScannerImpl.java:510)
at com.sun.org.apache.xerces.internal.parsers.XML11Configuration.parse(XML11Configuration.java:848)
at com.sun.org.apache.xerces.internal.parsers.XML11Configuration.parse(XML11Configuration.java:777)
at com.sun.org.apache.xerces.internal.parsers.XMLParser.parse(XMLParser.java:141)
at com.sun.org.apache.xerces.internal.parsers.AbstractSAXParser.parse(AbstractSAXParser.java:1213)
at com.sun.org.apache.xerces.internal.jaxp.SAXParserImpl$JAXPSAXParser.parse(SAXParserImpl.java:649)
at org.apache.tomcat.util.digester.Digester.parse(Digester.java:1561)
at org.apache.catalina.startup.Catalina.load(Catalina.java:615)
at org.apache.catalina.startup.Catalina.start(Catalina.java:677)
at sun.reflect.NativeMethodAccessorImpl.invoke0(Native Method)
at sun.reflect.NativeMethodAccessorImpl.invoke(NativeMethodAccessorImpl.java:62)
at sun.reflect.DelegatingMethodAccessorImpl.invoke(DelegatingMethodAccessorImpl.java:43)
at java.lang.reflect.Method.invoke(Method.java:497)
at org.apache.catalina.startup.Bootstrap.start(Bootstrap.java:321)
at org.apache.catalina.startup.Bootstrap.main(Bootstrap.java:455)
Jul 21, 2015 4:12:12 PM org.apache.catalina.startup.Catalina load
WARNING: Catalina.start using conf/server.xml: The element type "unmatched-element" must be terminated by the matching end-tag "</unmatched-element>".
Jul 21, 2015 4:12:12 PM org.apache.catalina.startup.Catalina start
SEVERE: Cannot start server. Server instance is not configured.
As expected, we can see here that the unmatched-element element has not been terminated in the server.xml file.
