3-3 Policies
If something happens, we need to fix a problem or raise an alert. Most organizations have a lot of important tools in this space. AMP aims to standardize and simplify their use in an organization, ensuring they are baked in blueprints, and pulling together the results so that all stakeholders get a holistic view.
A “policy” in Cloudsoft AMP consists of three aspects:
- Monitor: when should it run, usually either time-based or sensor-based
- Analyze/Plan: what checks should it do, ranging from a trivial condition or even always-apply, to sophisticated computation running external tools
- Execute: what action should it apply based on the analysis, often invoking an effector or emitting a sensor
In common parlance, a policy is often just a statement of what is and isn’t allowed. In order to be runnable, AMP’s philosophy is that a policy should include details of the monitoring, the analysis/planning, and the resulting execution. A policy statement that doesn’t specify when it needs checked (monitor) cannot be automated; similarly, a policy statement that doesn’t specify how it is evaluated (analyze/plan) cannot be automated; and a policy statement that doesn’t specify a consequence (execute) is useless!
In practice, these three aspects are simple to define and are often baked in to the policy being used, so that a blueprint author has minimal work to do. We will explore this with several in-life management policies building on the previous exercise. This is a short exercise – about 30 minutes – adding the policies in quick succession, then redeploying and exploring them.
Built-in policies: terraform drift
Some types in AMP have built-in policies. The Terraform type, for example, allows enabling drift detection: every minute (monitor), check that the Terraform template matches actual resources (analyze/plan), and emit a sensor indicating compliance or failure (execute).
To enable this, simply add the following to the two terraform entities:
    brooklyn.initializers:
      - type: terraform-drift-compliance-check
        brooklyn.config:
          terraform.resources-drift.enabled: true
Automation: scheduling actions
The next policy – the cron-scheduler installed as a policy to the AMP Catalog –
allows us to specify that effectors should be invoked according to a schedule:
the schedule is the monitor aspect,
the analyze/plan aspect is trivial because it always applies (although it could be enhanced to support conditions),
and the effector specified by the blueprint author is the execute aspect.
Here let’s attach a schedule to the EFS bastion server. It normally isn’t needed out-of-hours,
and it will save money and energy, and be more secure, to run it only during the day.
Because that Terraform template is a separate entity in AMP, we can control its lifecycle separately by
attaching this policy to that entity, instructing it to start at 8.30am and stop at 6.00pm M-F.
This can be done by adding the following block to the “Bastion Server” terraform entity,
using a brookyn.policies block rather than brooklyn.initializers because we are using a
policy saved in the catalog:
    brooklyn.policies:
      - type: cron-scheduler
        brooklyn.config:
          entries:
            - when: '0 30 8 * * mon-fri'
              effector: start
            - when: '0 0 18 * * mon-fri'
              effector: stop
Compliance: monitoring elastic storage use
Previously, we created two efs-size-* sensors.
One simple health and compliance check is to ensure that the size of data in EFS is reasonable.
Let’s add a new policy that checks if the size is too big, and a policy that if the size is too big,
publish a non-compliance dashboard sensor and open an issue.
In this case we are computing a sensor (what to execute), with a declared set of trigger sensors (the monitor) and conditional logic in AMP about whether it should run and in the script about the sensor’s value (the analysis/plan). The following is added at the root of the blueprint:
brooklyn.initializers:
  - type: workflow-sensor
    brooklyn.config:
      sensor:
        name: dashboard.utilization.filesystem_size
        type: compliance-check
      triggers:
        - efs-size-from-aws
        - efs-size-from-server
      condition:
        any:
          - sensor: efs-size-from-aws
            greater-than: 30000000
          - sensor: efs-size-from-server
            greater-than: 30000000
          - sensor: dashboard.utilization.filesystem_size
            check:
              jsonpath: pass
              when: falsy
      steps:
        - step: container cloudsoft/terraform
          env:
            SIZE_PER_AWS: ${entity.sensor['efs-size-from-aws']}
            SIZE_PER_SERVER: ${entity.sensor['efs-size-from-server']}
          command: |
            FAILURES=""
            if [ "$SIZE_PER_AWS" -gt 30000000 ] ; then
              FAILURES=$(echo $FAILURES AWS)
            fi
            if [ "$SIZE_PER_SERVER" -gt 30000000 ] ; then
              FAILURES=$(echo $FAILURES on-box-check)
            fi

            cat <<EOF
            id: efs-size-check
            created: $(date +"%Y%m%d-%H%M")
            EOF

            if [ -z "$FAILURES" ] ; then cat <<EOF
            summary: EFS size within bounds
            pass: true
            EOF
            else cat <<EOF
            summary: EFS size limit exceeded - $FAILURES
            pass: false
            EOF
            fi

            cat <<EOF
            notes: |2
              AWS reports size as: $SIZE_PER_AWS
              On-box reports size as: $SIZE_PER_SERVER
            EOF
        - transform out = ${stdout} | yaml | type compliance-check
        - return ${out}
There are a several new things going on here:
- It will be triggered whenever either of the
efs-size-*sensors are updated - It will only run if one of a few conditions are met, using the Predicate DSL to define the conditions
as either of sizes exceeding 30 mb or if this
compliance-checksensor previously failed (there is no reason to execute if both sizes are below the max and the previous check reported as passed, although it could) - The
jsonpathargument in the condition tells AMP to convert the sensor to JSON and retrieve a specific field within it, so it will look at thepassargument from the previous output - The
when: falsyclause tells AMP not just to match an explicitfalsevalue but anything which commonly indicates an absence of explicit truth, specifically if it is missing (ornull,0, or"") - If the conditions are met, two shell environment variables are initialized to the sensor’s values and passed to the script
- The
bashScriptchecks whether either size is exceeded and outputs YAML that corresponds to thecompliance-checktype, either passing or failing; the resulting object is emitted as thedashboard.utilization.filesystem_sizesensor - Finally, sensors prefixed
dashboard.and sensors of thecompliance-checkordashboard-infotypes get special treatment: these are aggregated upwards in the management hierarchy and reported in the AMP dashboard, so any non-compliance anywhere in a deployment is rapidly flagged in the UI and any such non-compliance can be used to trigger other events (such as a ServiceNOW incident or an alert)
 Type-coercion, TOSCA, and
 scalar-unit.size type
⌃
Security: scanning servers
The previous example was an “off-box” policy;
we can also produce dashboard compliance-check sensors by running policies “on-box”.
In this example, we will use the open-source security scan tool lynis to
ensure the bastion server is compliant with security best practices,
this time running periodically (the trigger), and using a pre-supplied script (the analysis/plan)
to generate the value of the sensor that is published (what the policy executes).
This should be added to the existing member.initializers block in the “EFS Bastion Server (grouped)” policy
to apply it to discovered bastion servers:
                - type: workflow-sensor
                  brooklyn.config:
                    sensor:
                      name: dashboard.security.lynis
                      type: compliance-check
                    steps:
                      - load script = classpath://io/cloudsoft/amp/compliance/lynis/lynis-result-sensor.sh
                      - type: ssh
                        command: ${script}
                      - transform out = ${stdout} | yaml | type compliance-check
                      - return ${out}
                    period: 5m
Putting it all together
Deploy this as before by unmanaging the previous deployment,
copying this blueprint
to the composer, setting the bucket_name and demo_name,
and optionally putting your public key in the authorized_keys parameter.
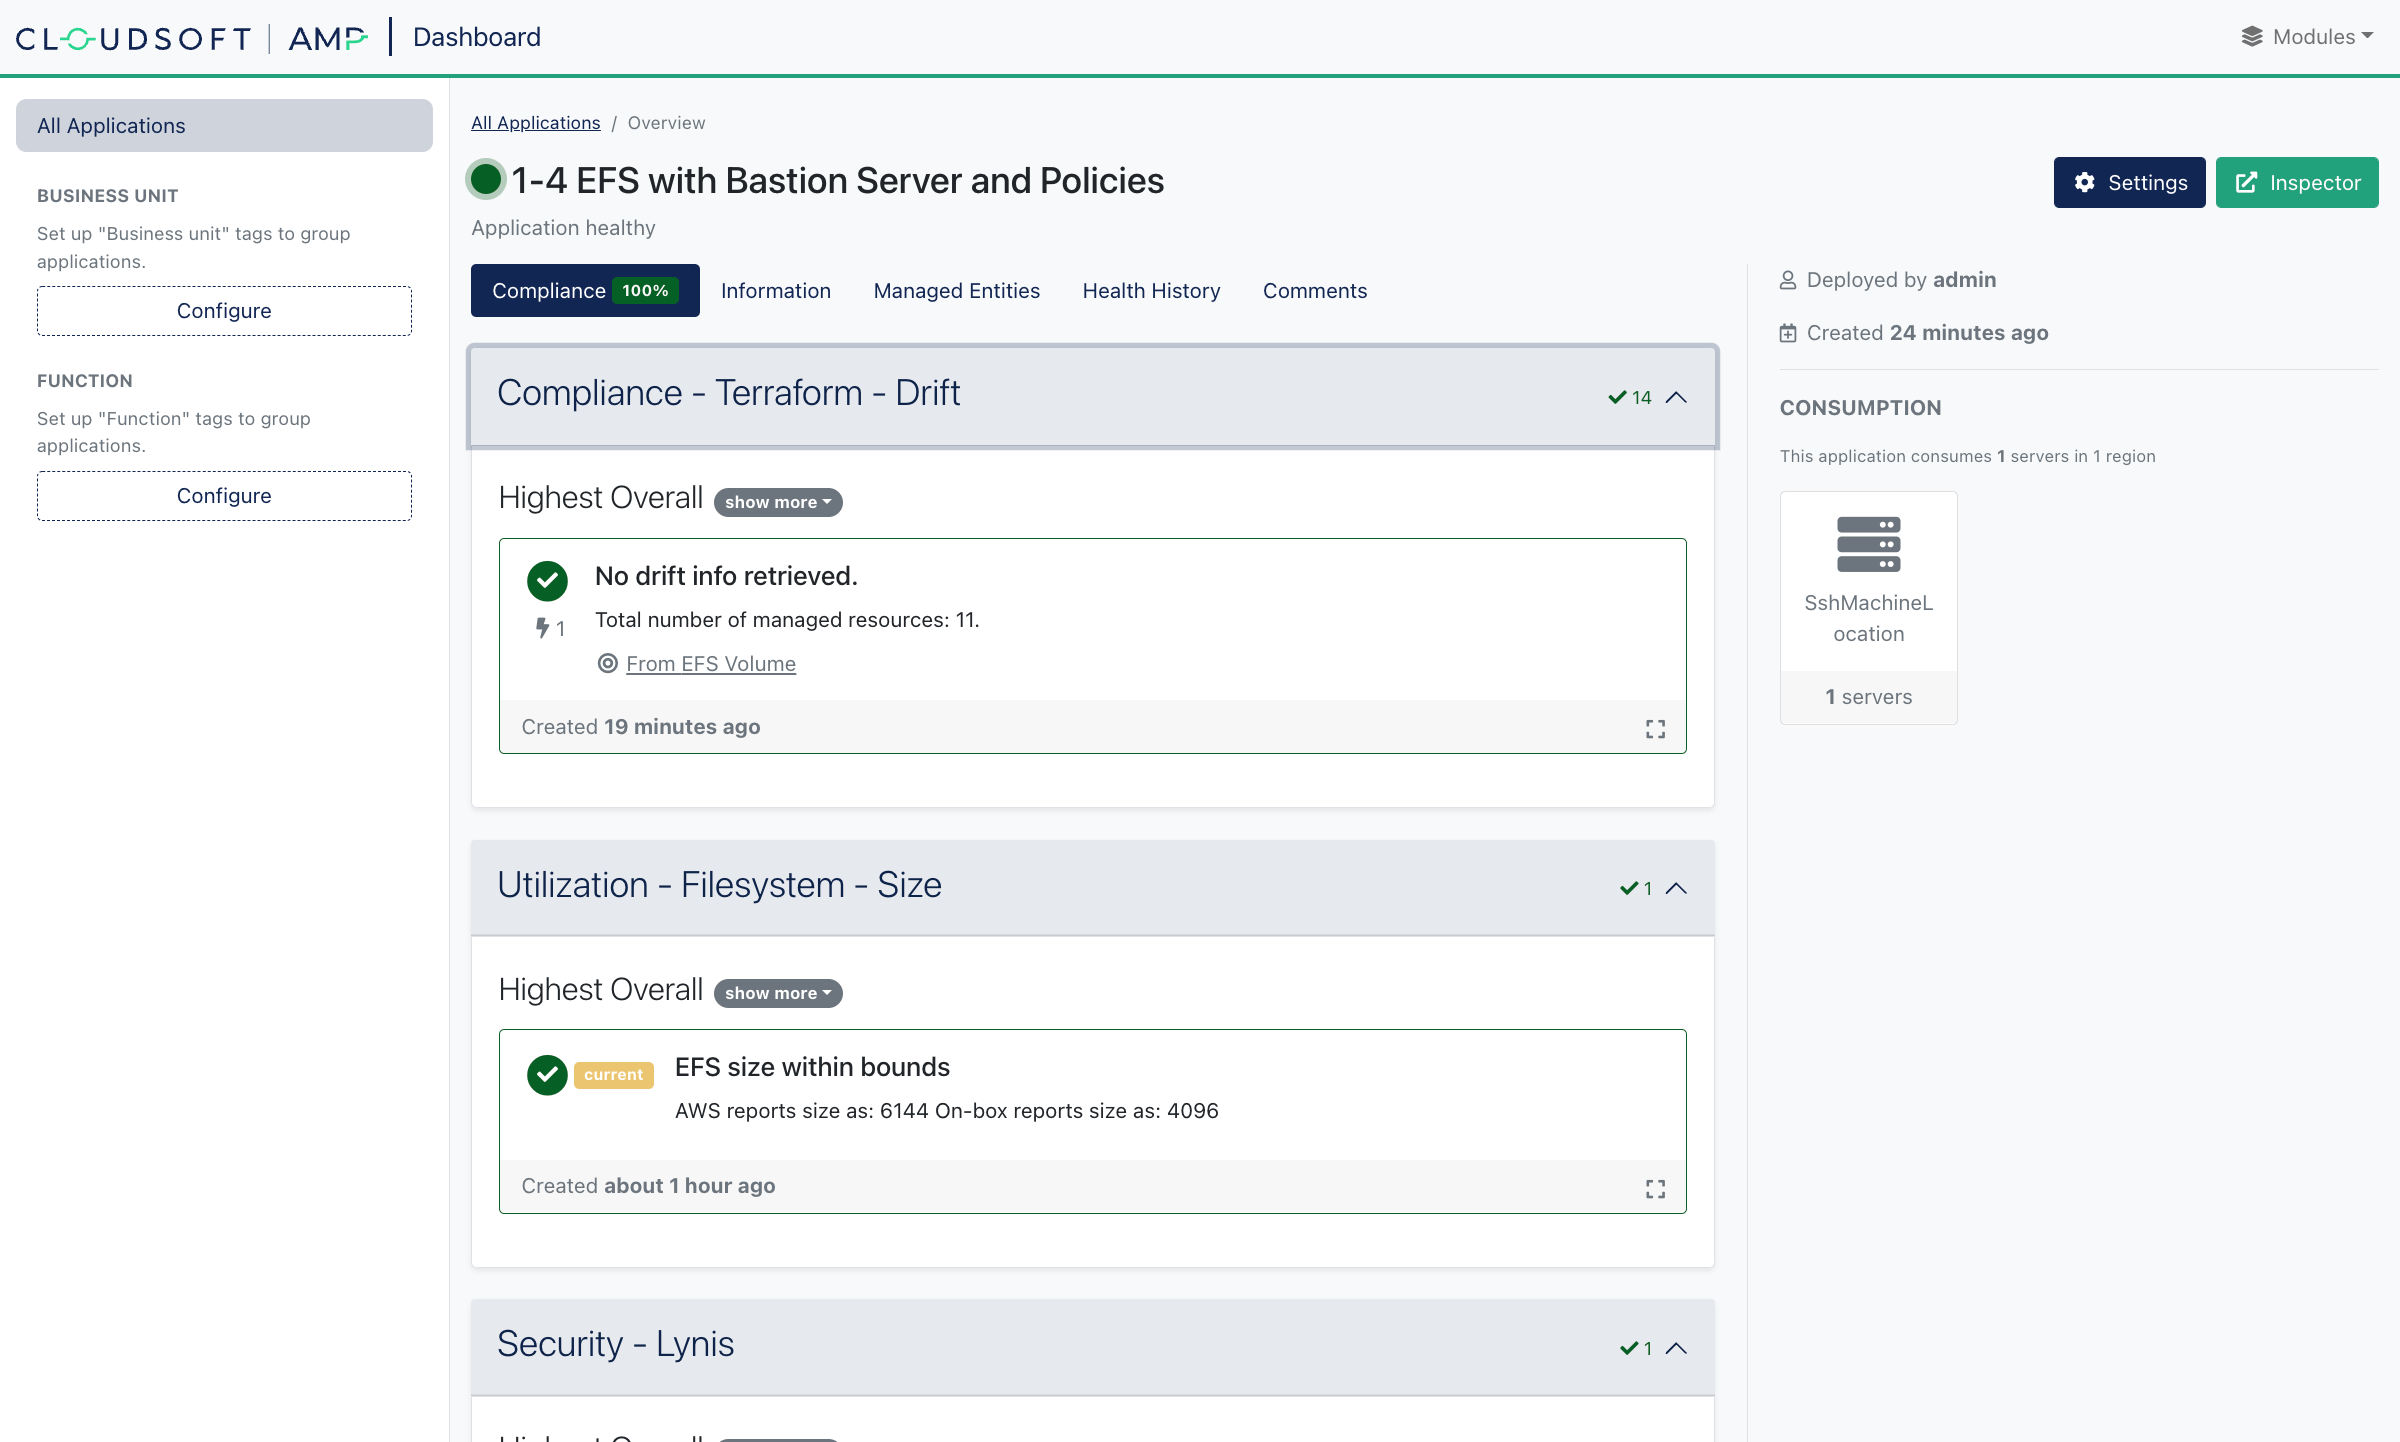
Once deployment is complete, let’s explore the various policies. This time, we’ll use the “Dashboard”. The application should show as compliant, with some details:

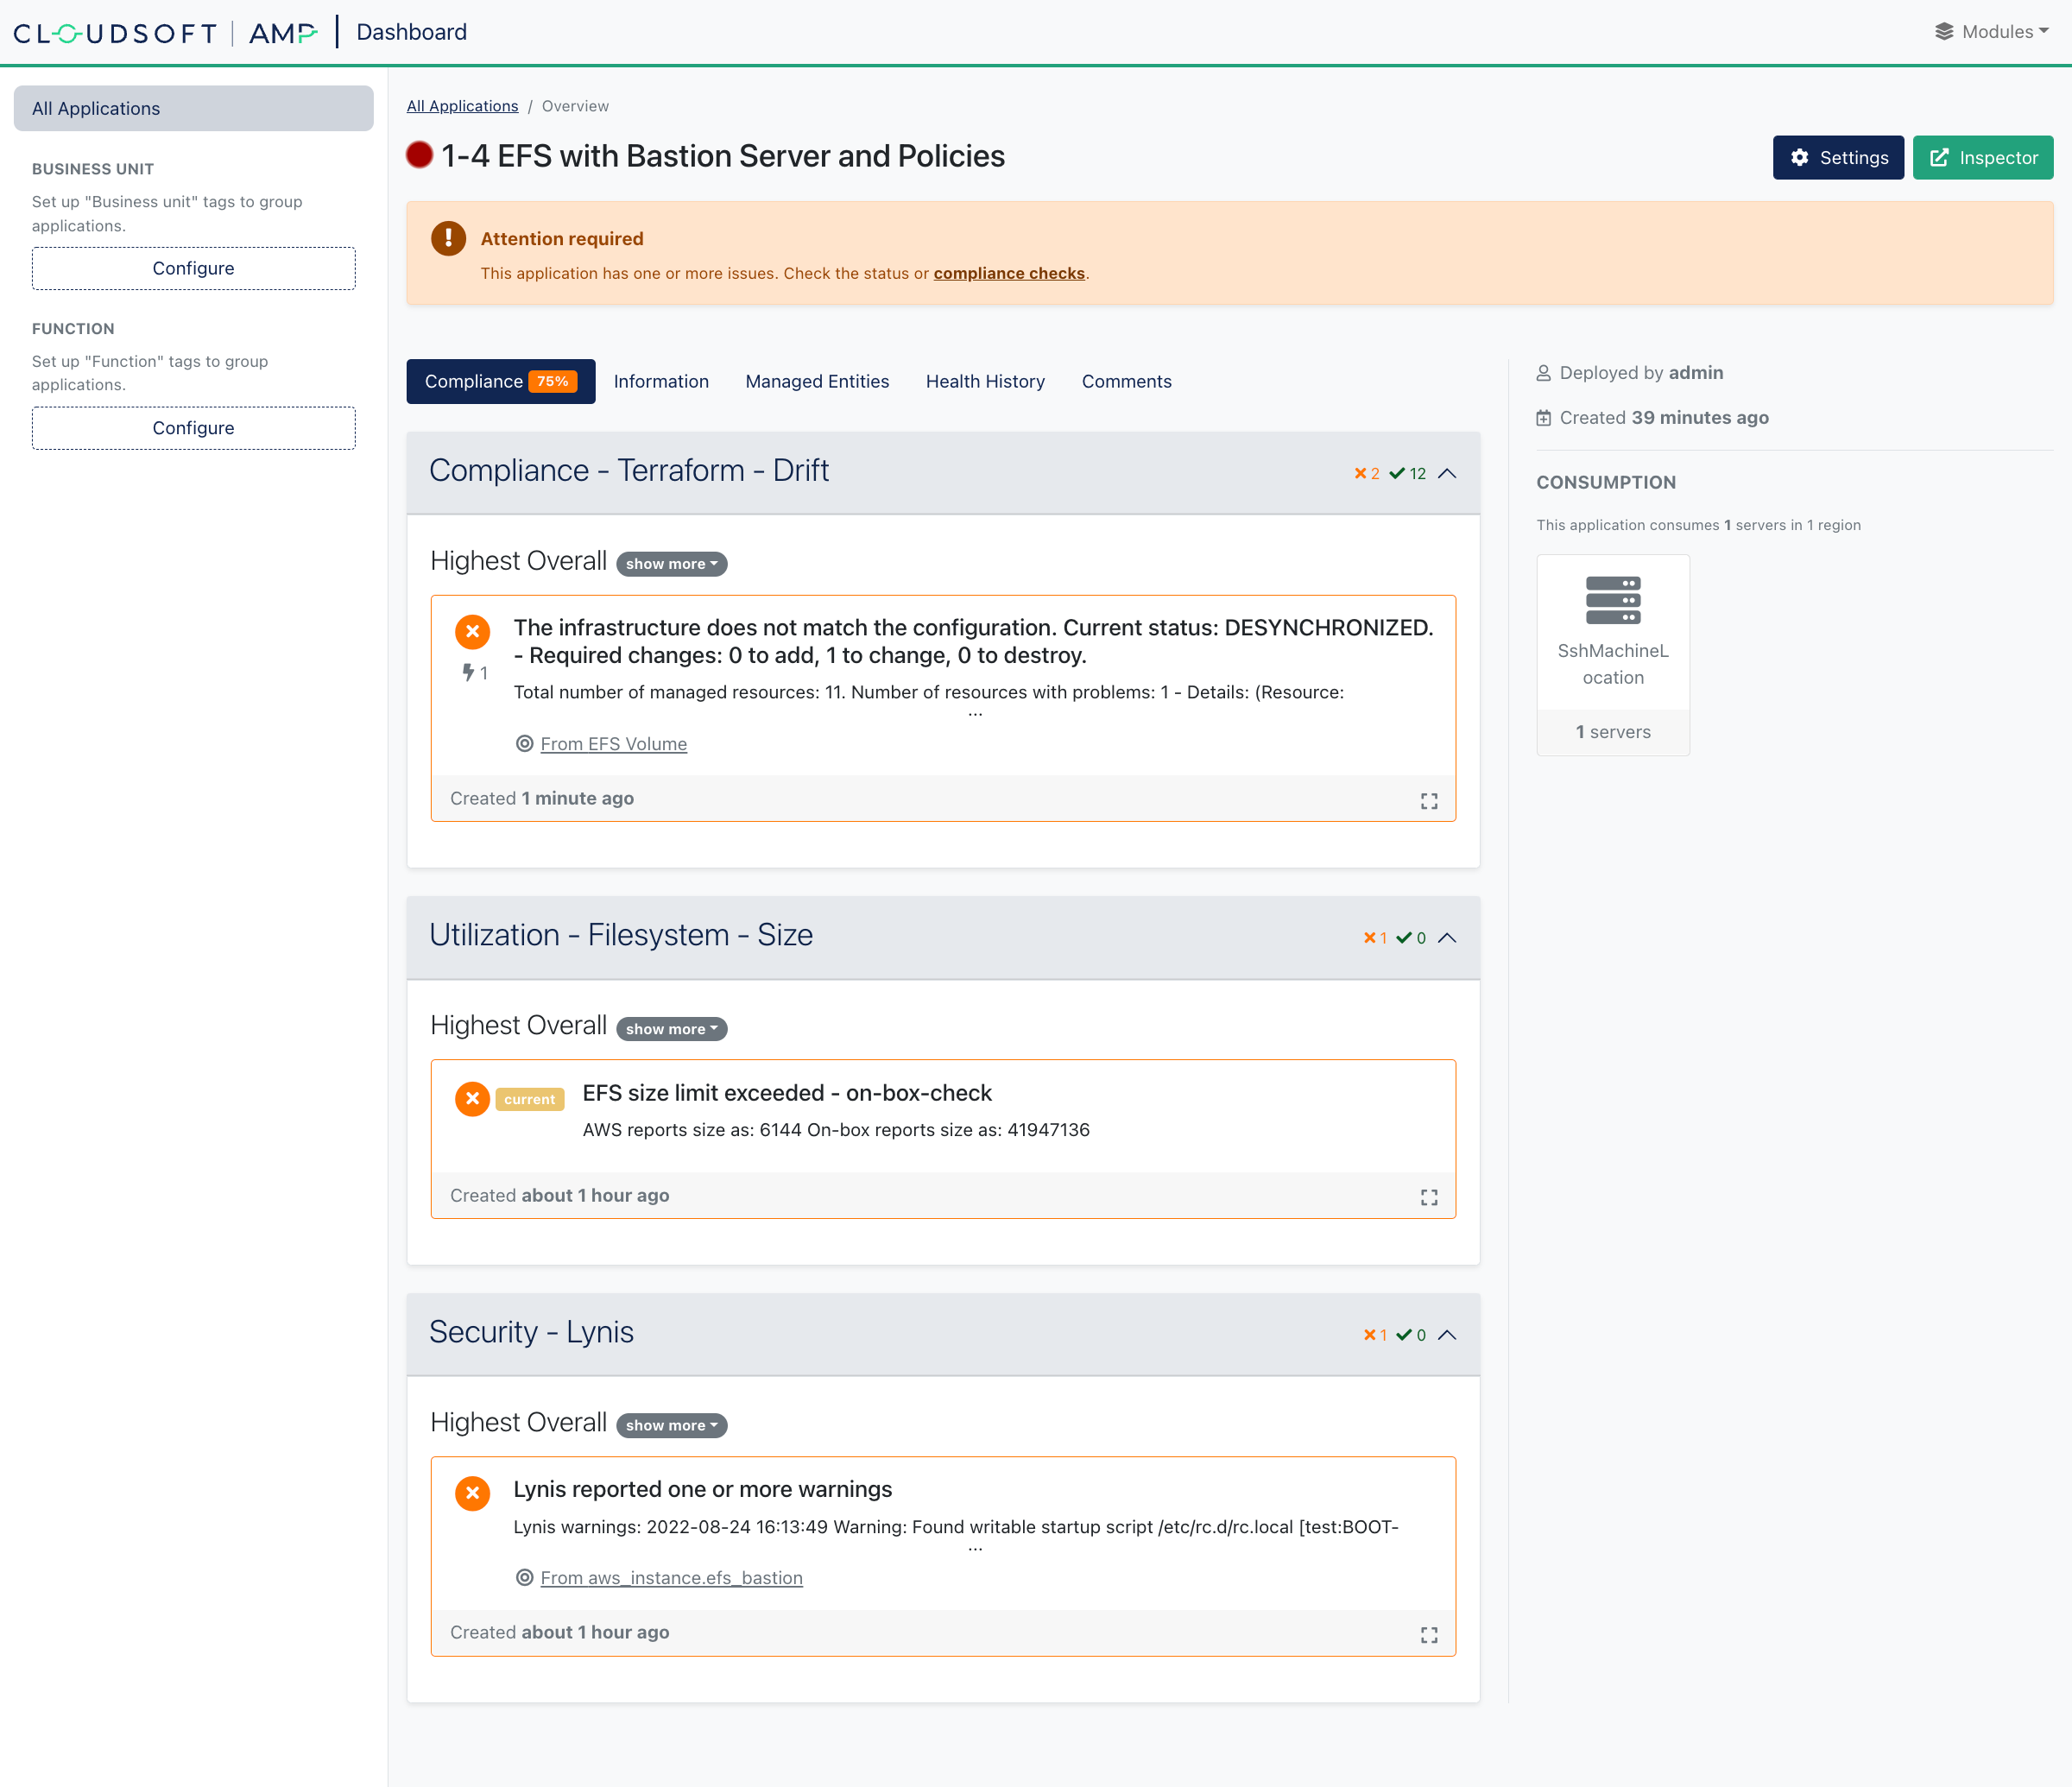
However we can trigger violations for each:
- Open a port on the security group in AWS to trigger drift violation
- Write another large file to EFS to trigger a size violation,
such as
dd if=/dev/random of=/mnt/shared-file-system/big-file-2.bin bs=4k iflag=fullblock,count_bytes count=40M - Do something naughty on the bastion sever to trigger a Lynis violation,
such as
sudo chmod 666 /etc/rc.d/rc.local

To see more detail, you can switch to the inspector and use the Management tab to see summary information for the policies and enrichers that are running, and drill down to see individual activity and log messages for everything it is doing.
To test the cron-scheduler policy, simply leave AMP running until after 6pm.
(If it’s already after 6pm, manually stop the bastion server once you’ve done the above tests
and wait until 8.30am to see it start.)
 Faking time
⌃
Fixing problems, manually and automatically
In some cases, the solution to a problem detected is obvious:
- For the extra port on the security group, simply run the
applyeffector on that terraform entity in AMP. That violation should be cleared up. - For the non-compliant server, since it’s effetively stateless, we can just restart that terraform entity,
tearing it down and re-creating it. Or we can
tainttheaws_instance, thenapplythe terraform, to re-create just that resource.
In other cases, such as if the EFS size is too large, that might require manual remediation.
In all cases, AMP aims to give the users the right balance of automation and visibility to enable automatic or manual remediation, alerting, and observability. Key information is surfaced in ways that stakeholders can use it without needing to be technical experts in AWS, or Terraform, or Kubernetes, or ServiceNOW. Subject-matter experts who need deeper insight can use AMP to navigate to that information more quickly. And these policies – for compliance, utilization, reporting, anything – can be standardized and re-used.
Tidying up
Now you have learned a rich set of AMP basics.
To tear down the deployments, click the stop effector on the root applications in AMP rather than Unmanage,
apart from the “S3” application.
The “S3” application cannot be destroyed by Terraform until the state files it created are removed.
(Terraform leaves near-empty state files in S3 even after a terraform destroy.)
You can simply delete the bucket in AWS (manually) or delete all the files in that bucket,
and then you will be able to stop the application in AMP.
Or you can use what you’ve learned to add a workflow-effector that uses a container step to run aws s3 rb s3://${BUCKET_NAME} --force,
picking a container image with the aws CLI installed and passing the bucket name and AWS credentials as env variables.