Progress map
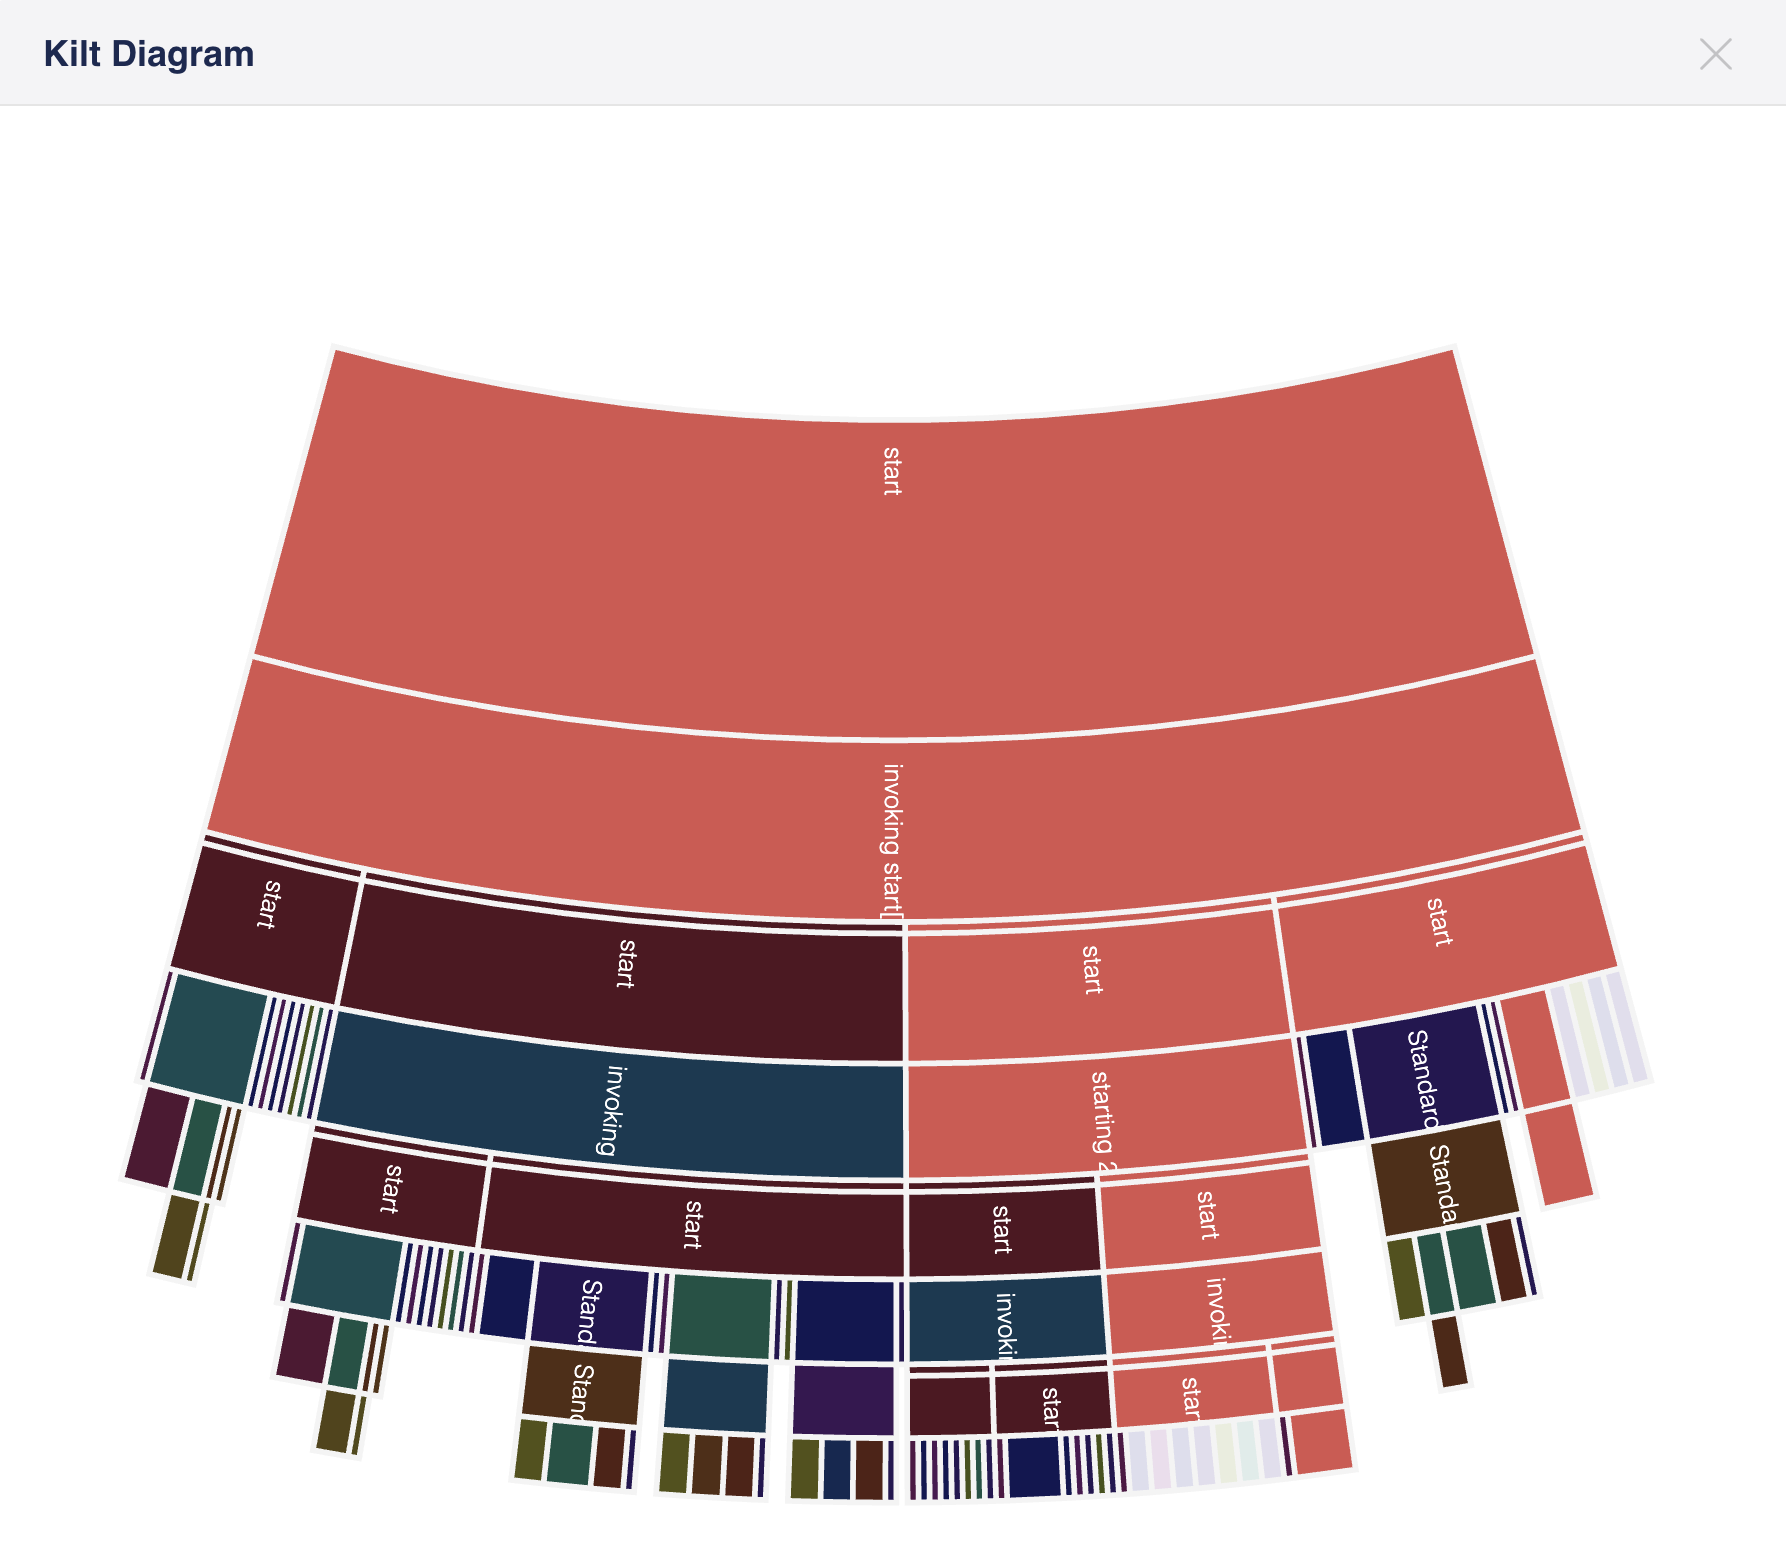
The Progress Map diagram is our Scottish kilt-like way of displaying information of entity’s tasks in a condensed and informational way. All tasks are represented in the diagram with parent/child relationship. When hovering over each, it will provide more information such as:
- task name
- task description
- start time
- completion time
- status
The following diagram demonstrates the task split in application deployment:
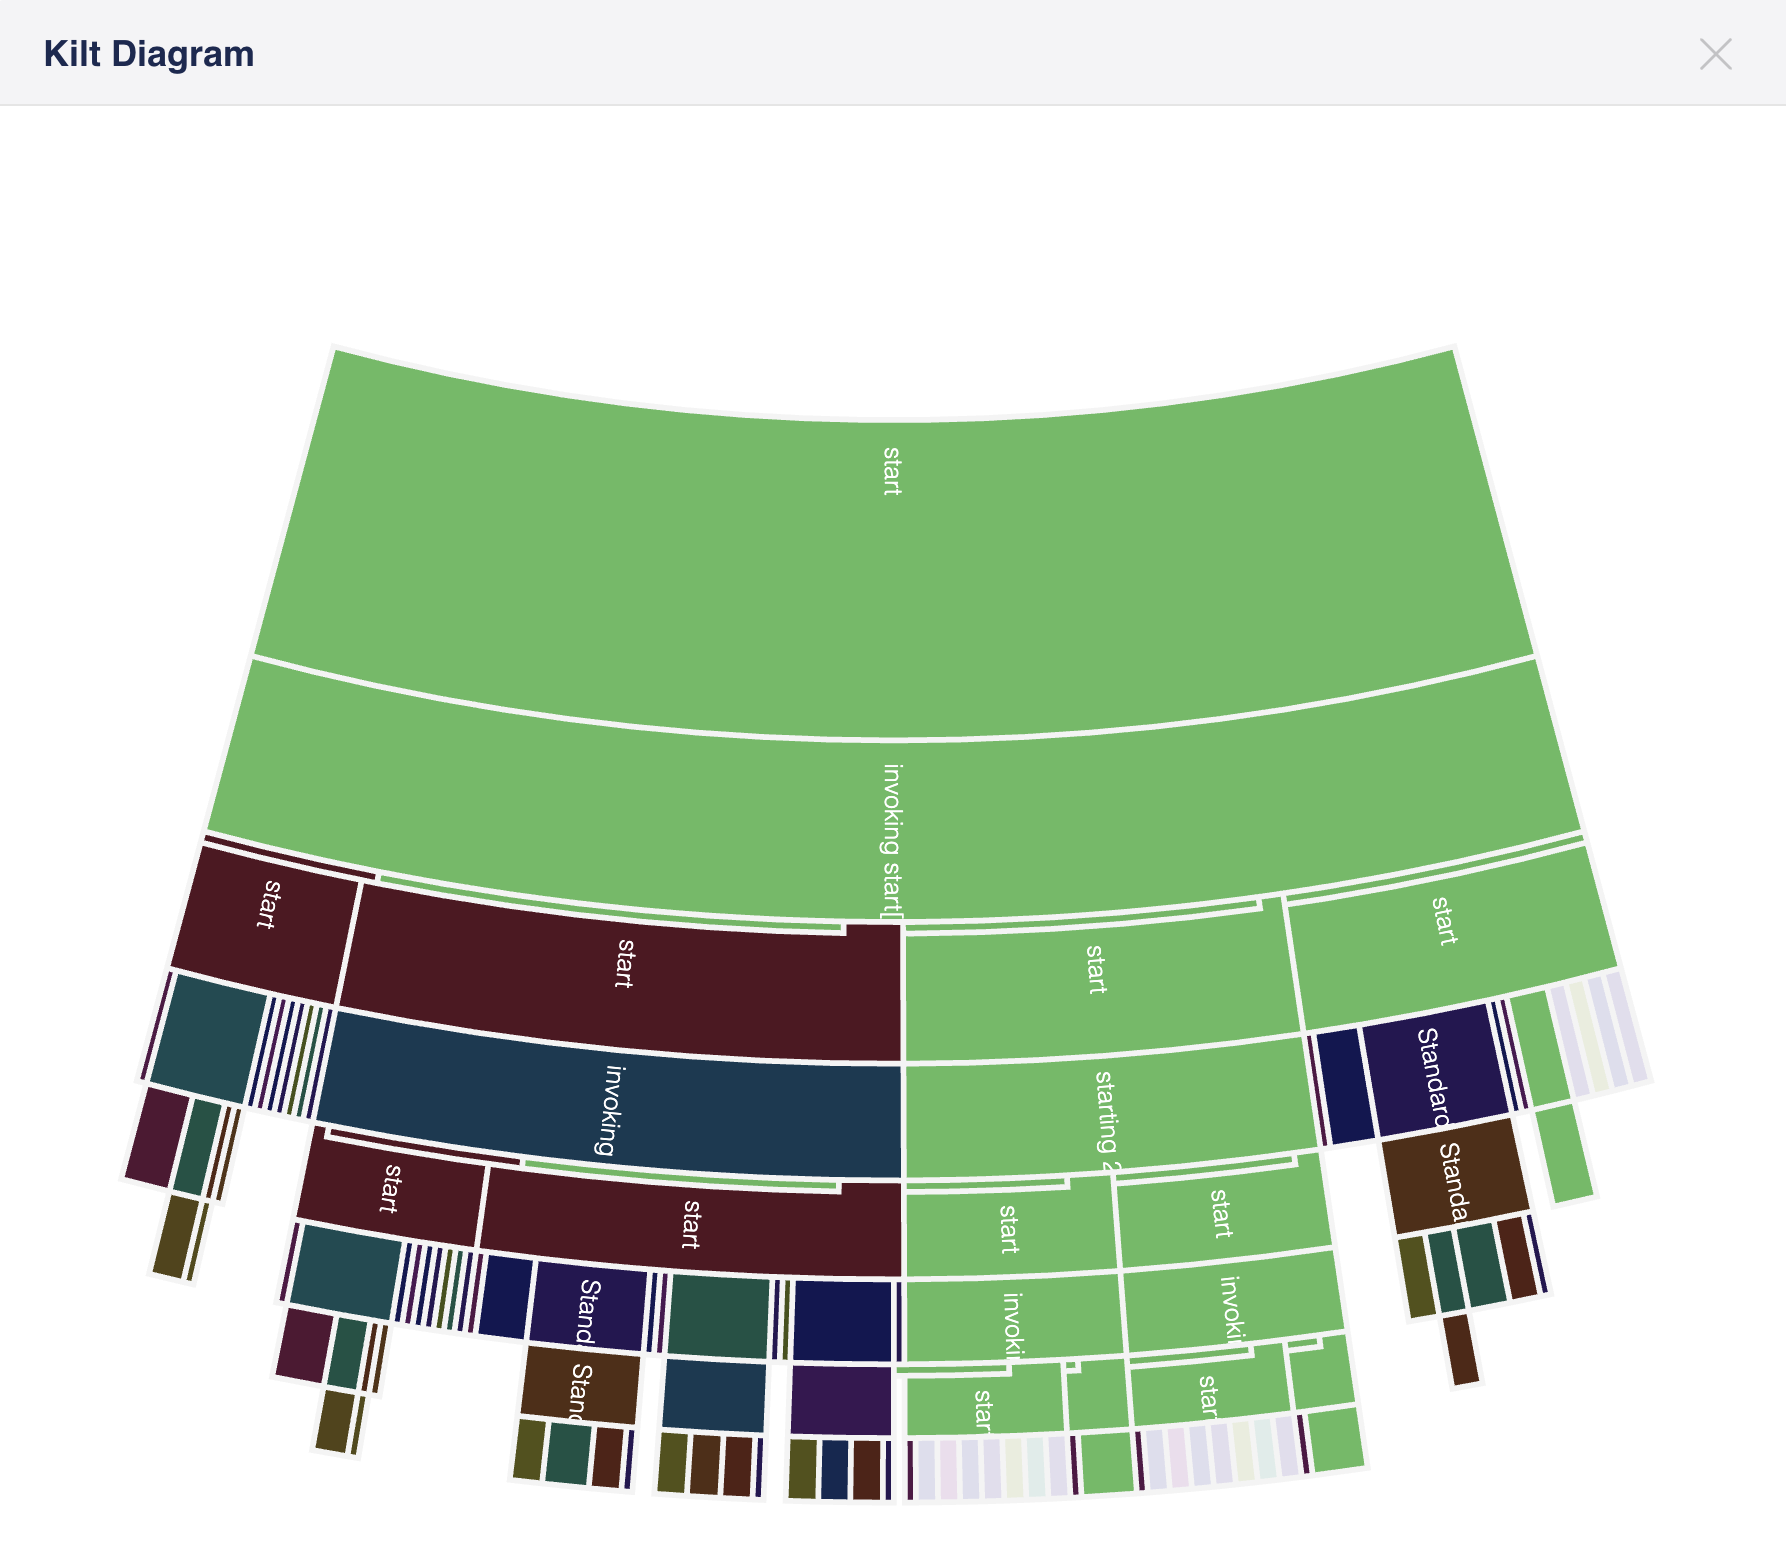
Active (started) tasks are shown in green.
Not yet started tasks are shown in a faint color, other than red and green. This color is computed based on a hash of the task name and other identifying information, so similar tasks will have the same color, such as "start" in the image below.
Successfully completed tasks are shown in a darker variant of the color, generated for the task prior to starting.
Failed tasks are shown in red.